Jonnel Mendoza

Data Analyst
Technical Skills
Excel, Tableau, Power BI, SQL, Python, Artificial Intelligence, Data Visualisation, Data Storytelling
Soft Skills
Effective Communication, Collaboration and Teamwork, Problem-Solving, Creativity, Strong attention to detail, Self-motivated and proactive, Adaptability, Interpersonal Skills and Continuous Learning
View My GitHub Portfolio
View My Streamlit Profile
View My LinkedIn Profile
View My Tableau Public
Portfolio
Current Project
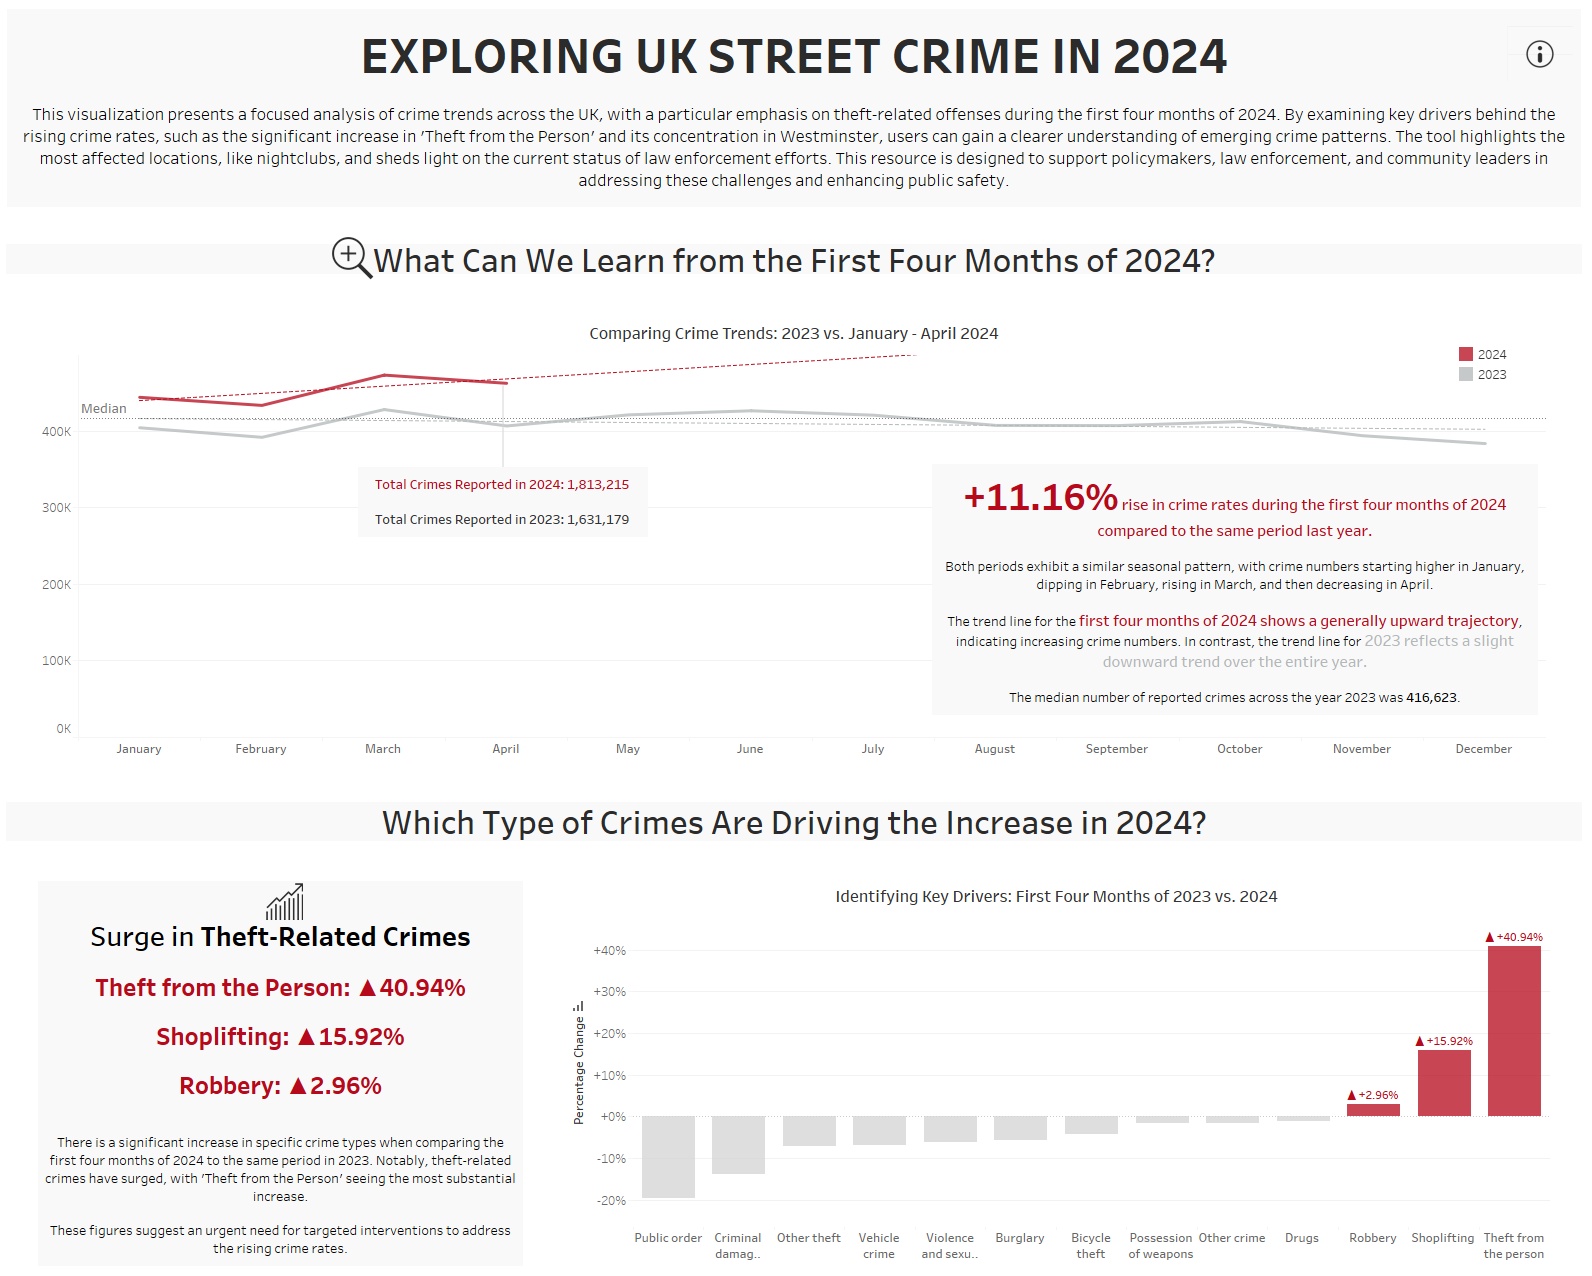
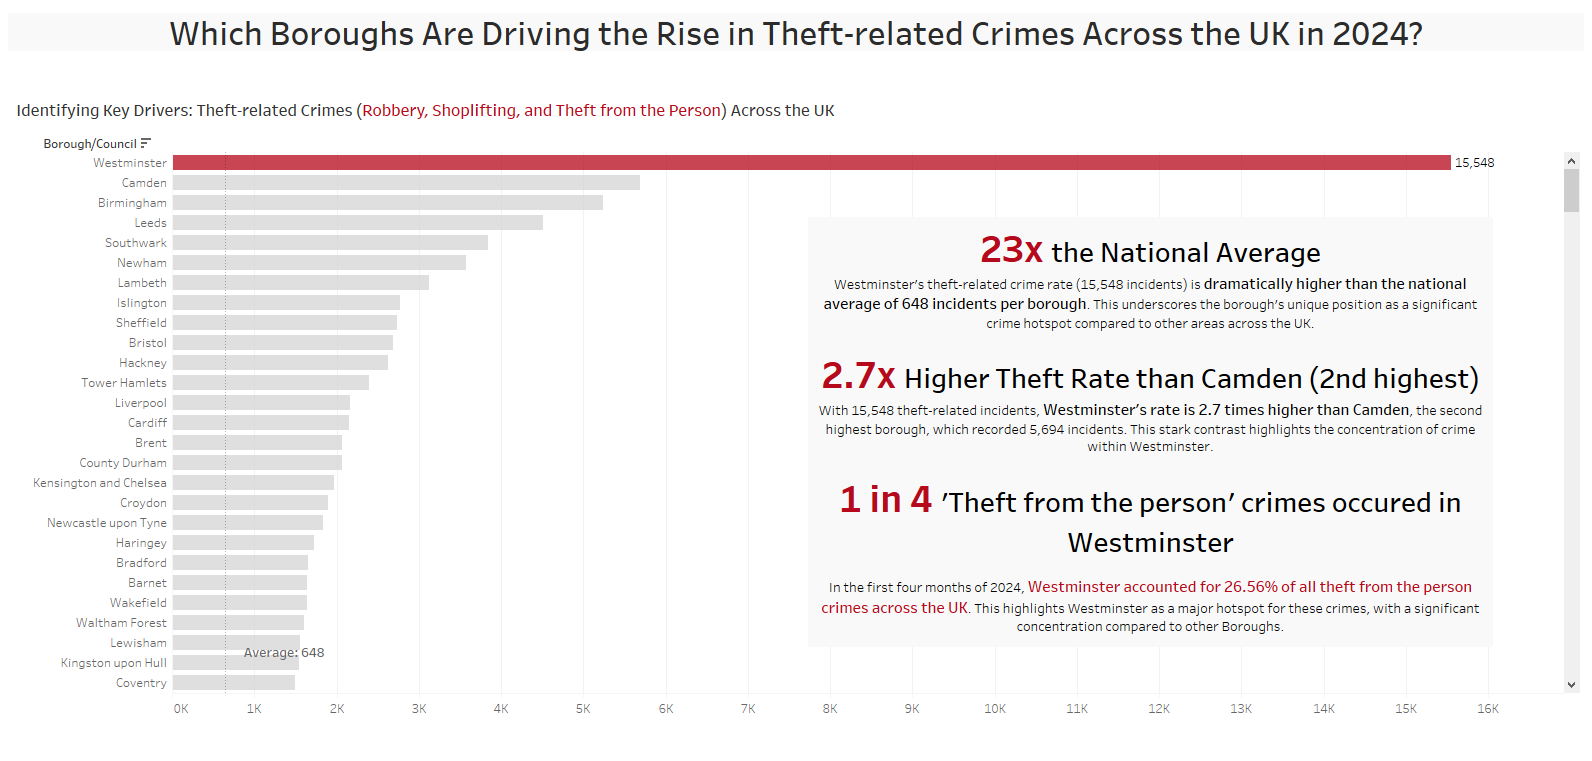
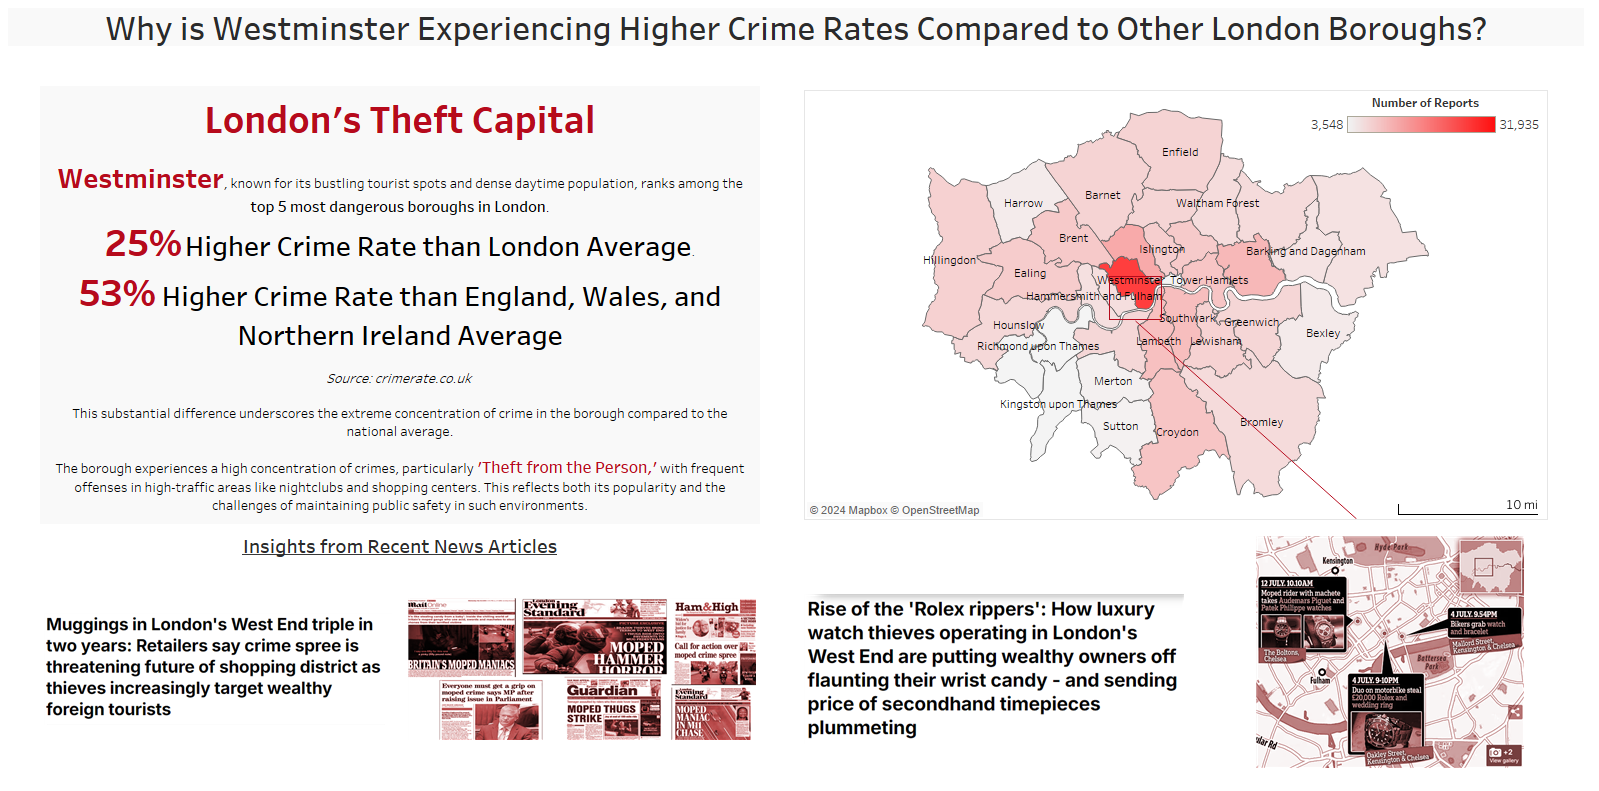
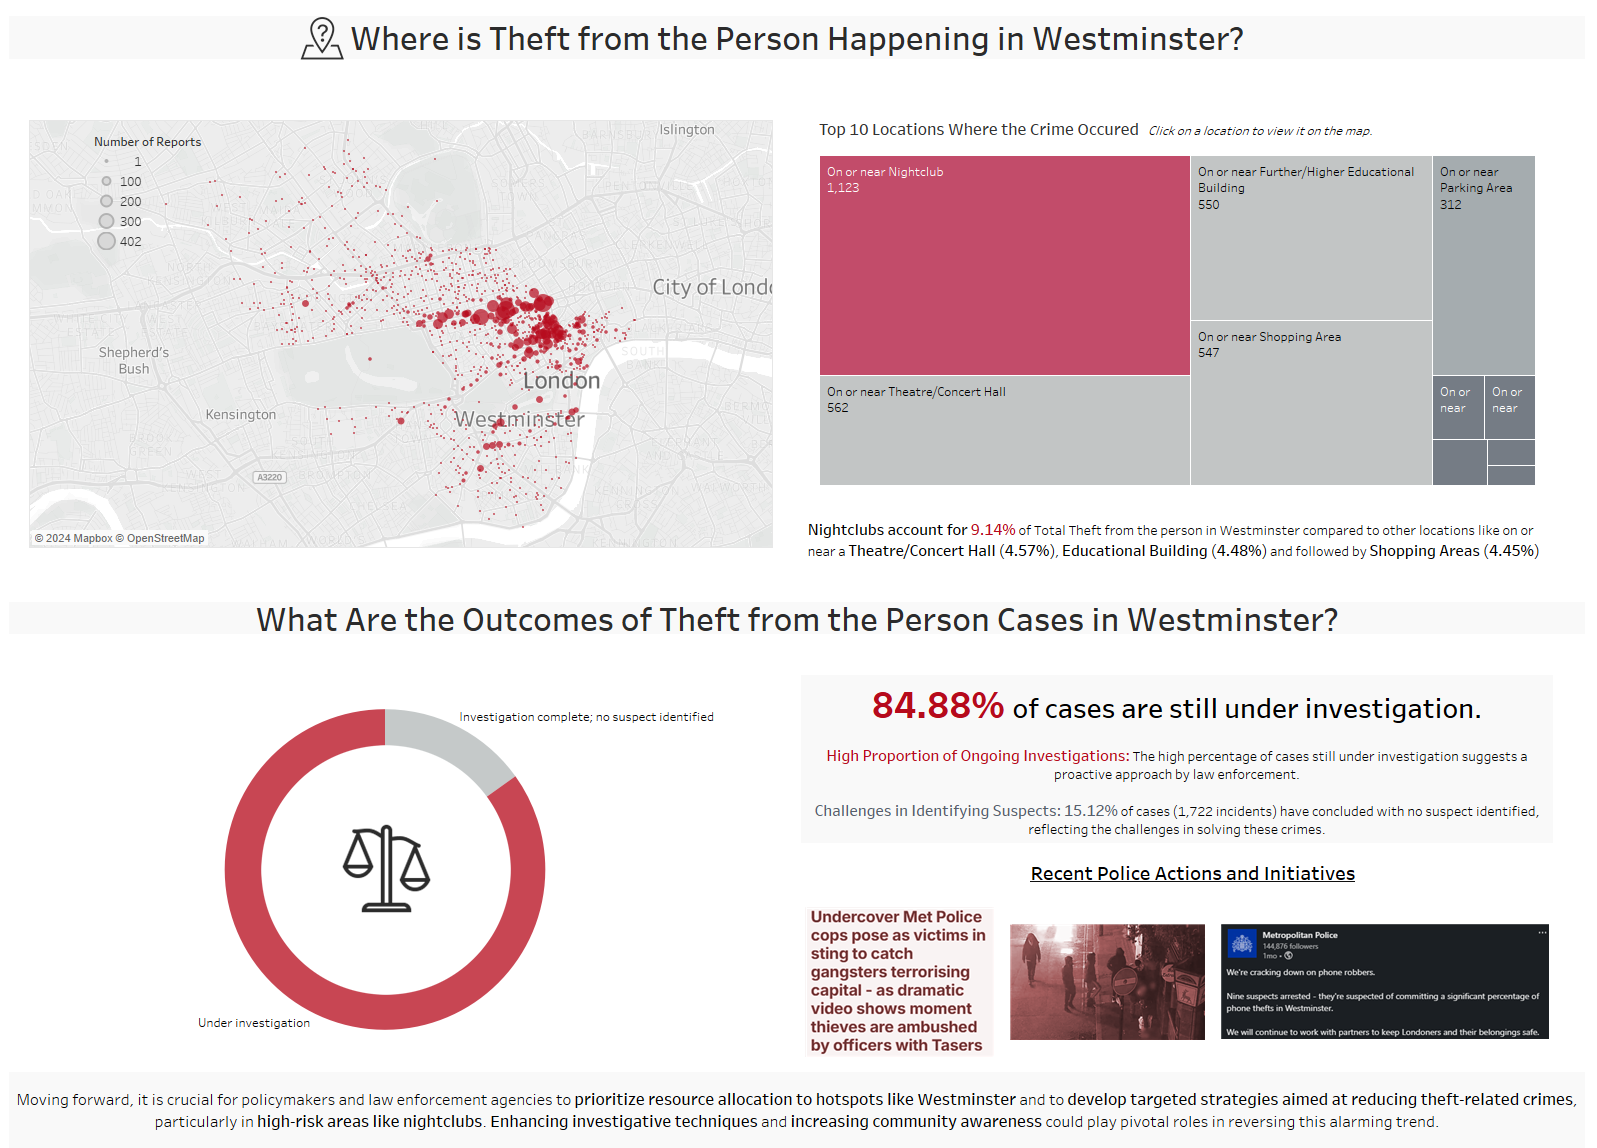
Tableau - UK Street Crime 2024 | Analysis - FINAL
Tools Used for this Project
Python and Tableau
Etsy Shop | Full Year Calendar Heatmap - Sales & Forecast Summary
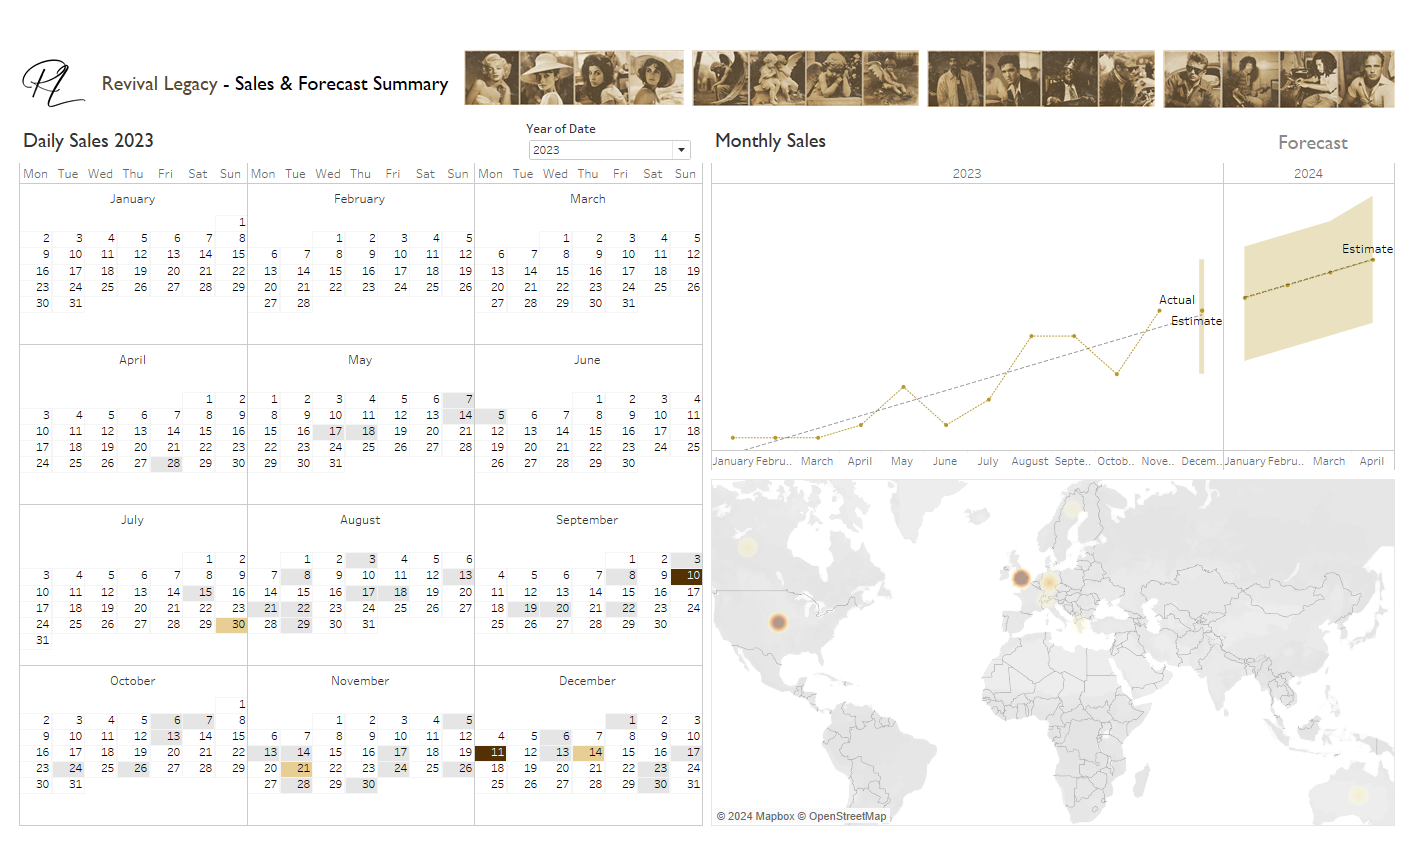
Purpose
To analyze and visualize sales performance of an Etsy shop over the course of a year, providing insights into sales trends, monthly performance, and geographical distribution of orders.
Objectives
This project aims to offer a comprehensive overview of sales performance and help in making data-driven decisions for optimizing sales strategies and improving forecasting accuracy.
Tools Used for this Project
Tableau
Cardiac Triage Questionnaire App (app)
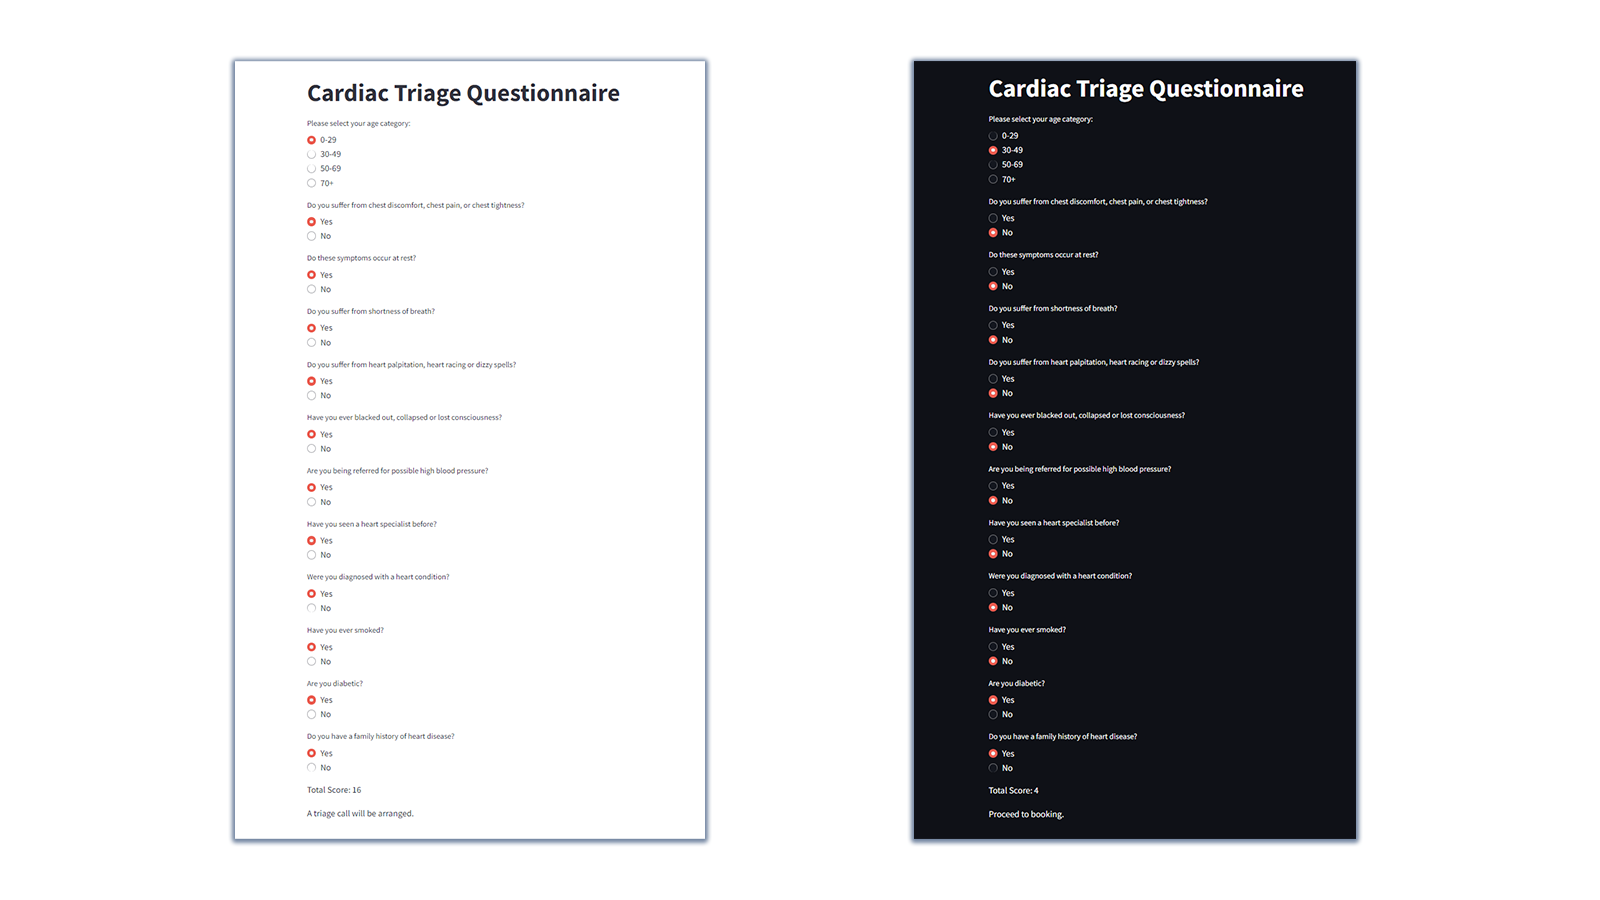
Purpose and Objectives
The Cardiac Triage Questionnaire app is designed to streamline the patient intake process by assessing and recording the severity of cardiac symptoms upon arrival or registration. Using a simple Python-based interface, this tool provides a quick and efficient way to prioritize patient care based on their triage scores.
The primary purpose of the app is to facilitate effective and timely triage decisions in a healthcare setting. By evaluating patient responses to a series of pre-defined questions, the app calculates a total score that indicates the urgency of the patient's condition.
Scoring and Action
The app can be seamlessly embedded into an HTML website or integrated into existing applications, providing a user-friendly interface for healthcare professionals and enhancing patient management efficiency.
Key Points:
Tools Used for this Project
Python and Streamlit
Latest Project
Insights into Healthcare Costs | Identifying Key Drivers (Data Analysis)

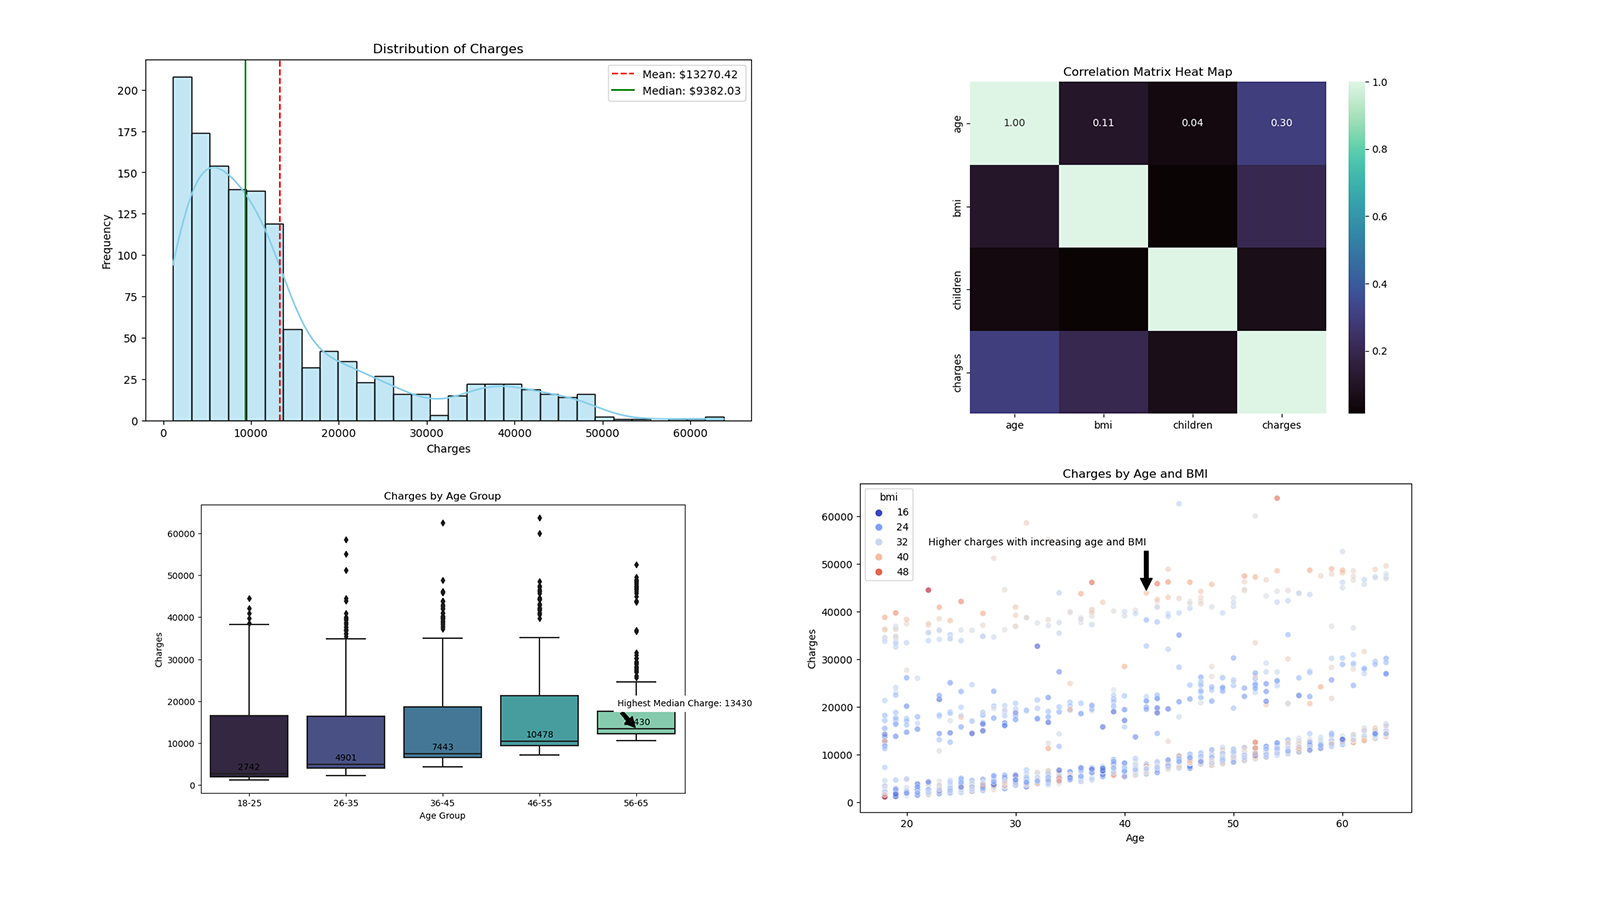
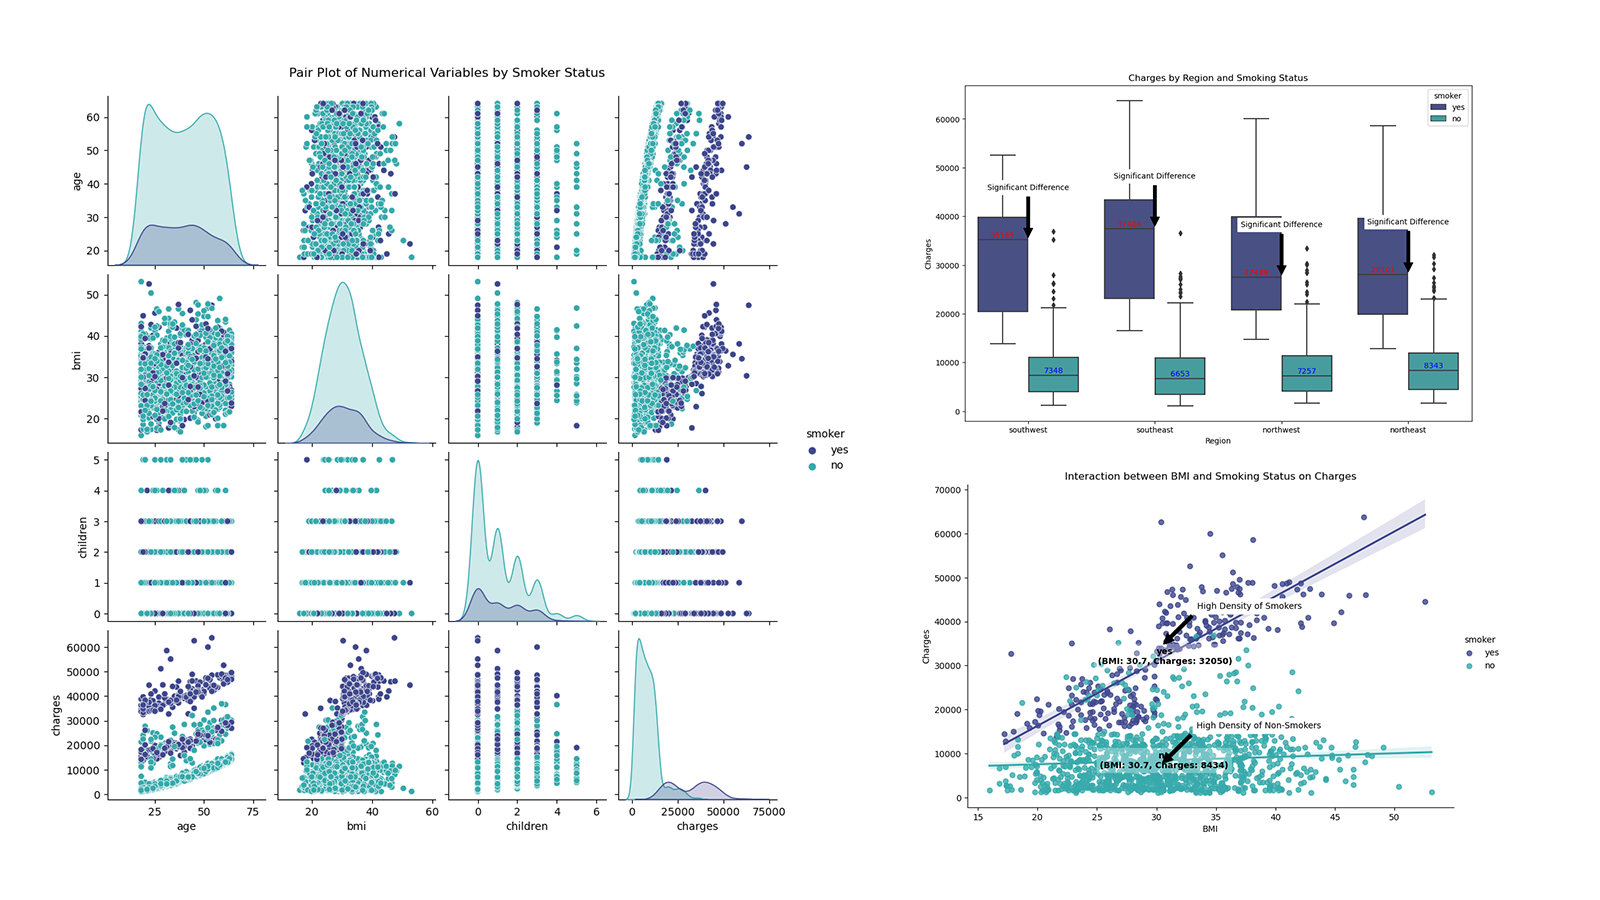
Purpose and Objectives
To understand the factors that influence medical insurance costs and to develop predictive model for estimating healthcare expenses. My analysis will be focused on both the descriptive and diagnostic aspect, leveraging individual data to build models that can forecast or estimate future healthcare expenditures, rather than solely describing past trends or prescribing actions.
Scope
Tools Used for this Project
Python, Pandas, Seaborn, Matplotlib and PowerPoint
Tableau - UK Police Force | Street Crime Dashboard | January - April 2024: Monitoring Trends and Hotspots (Dashboard)
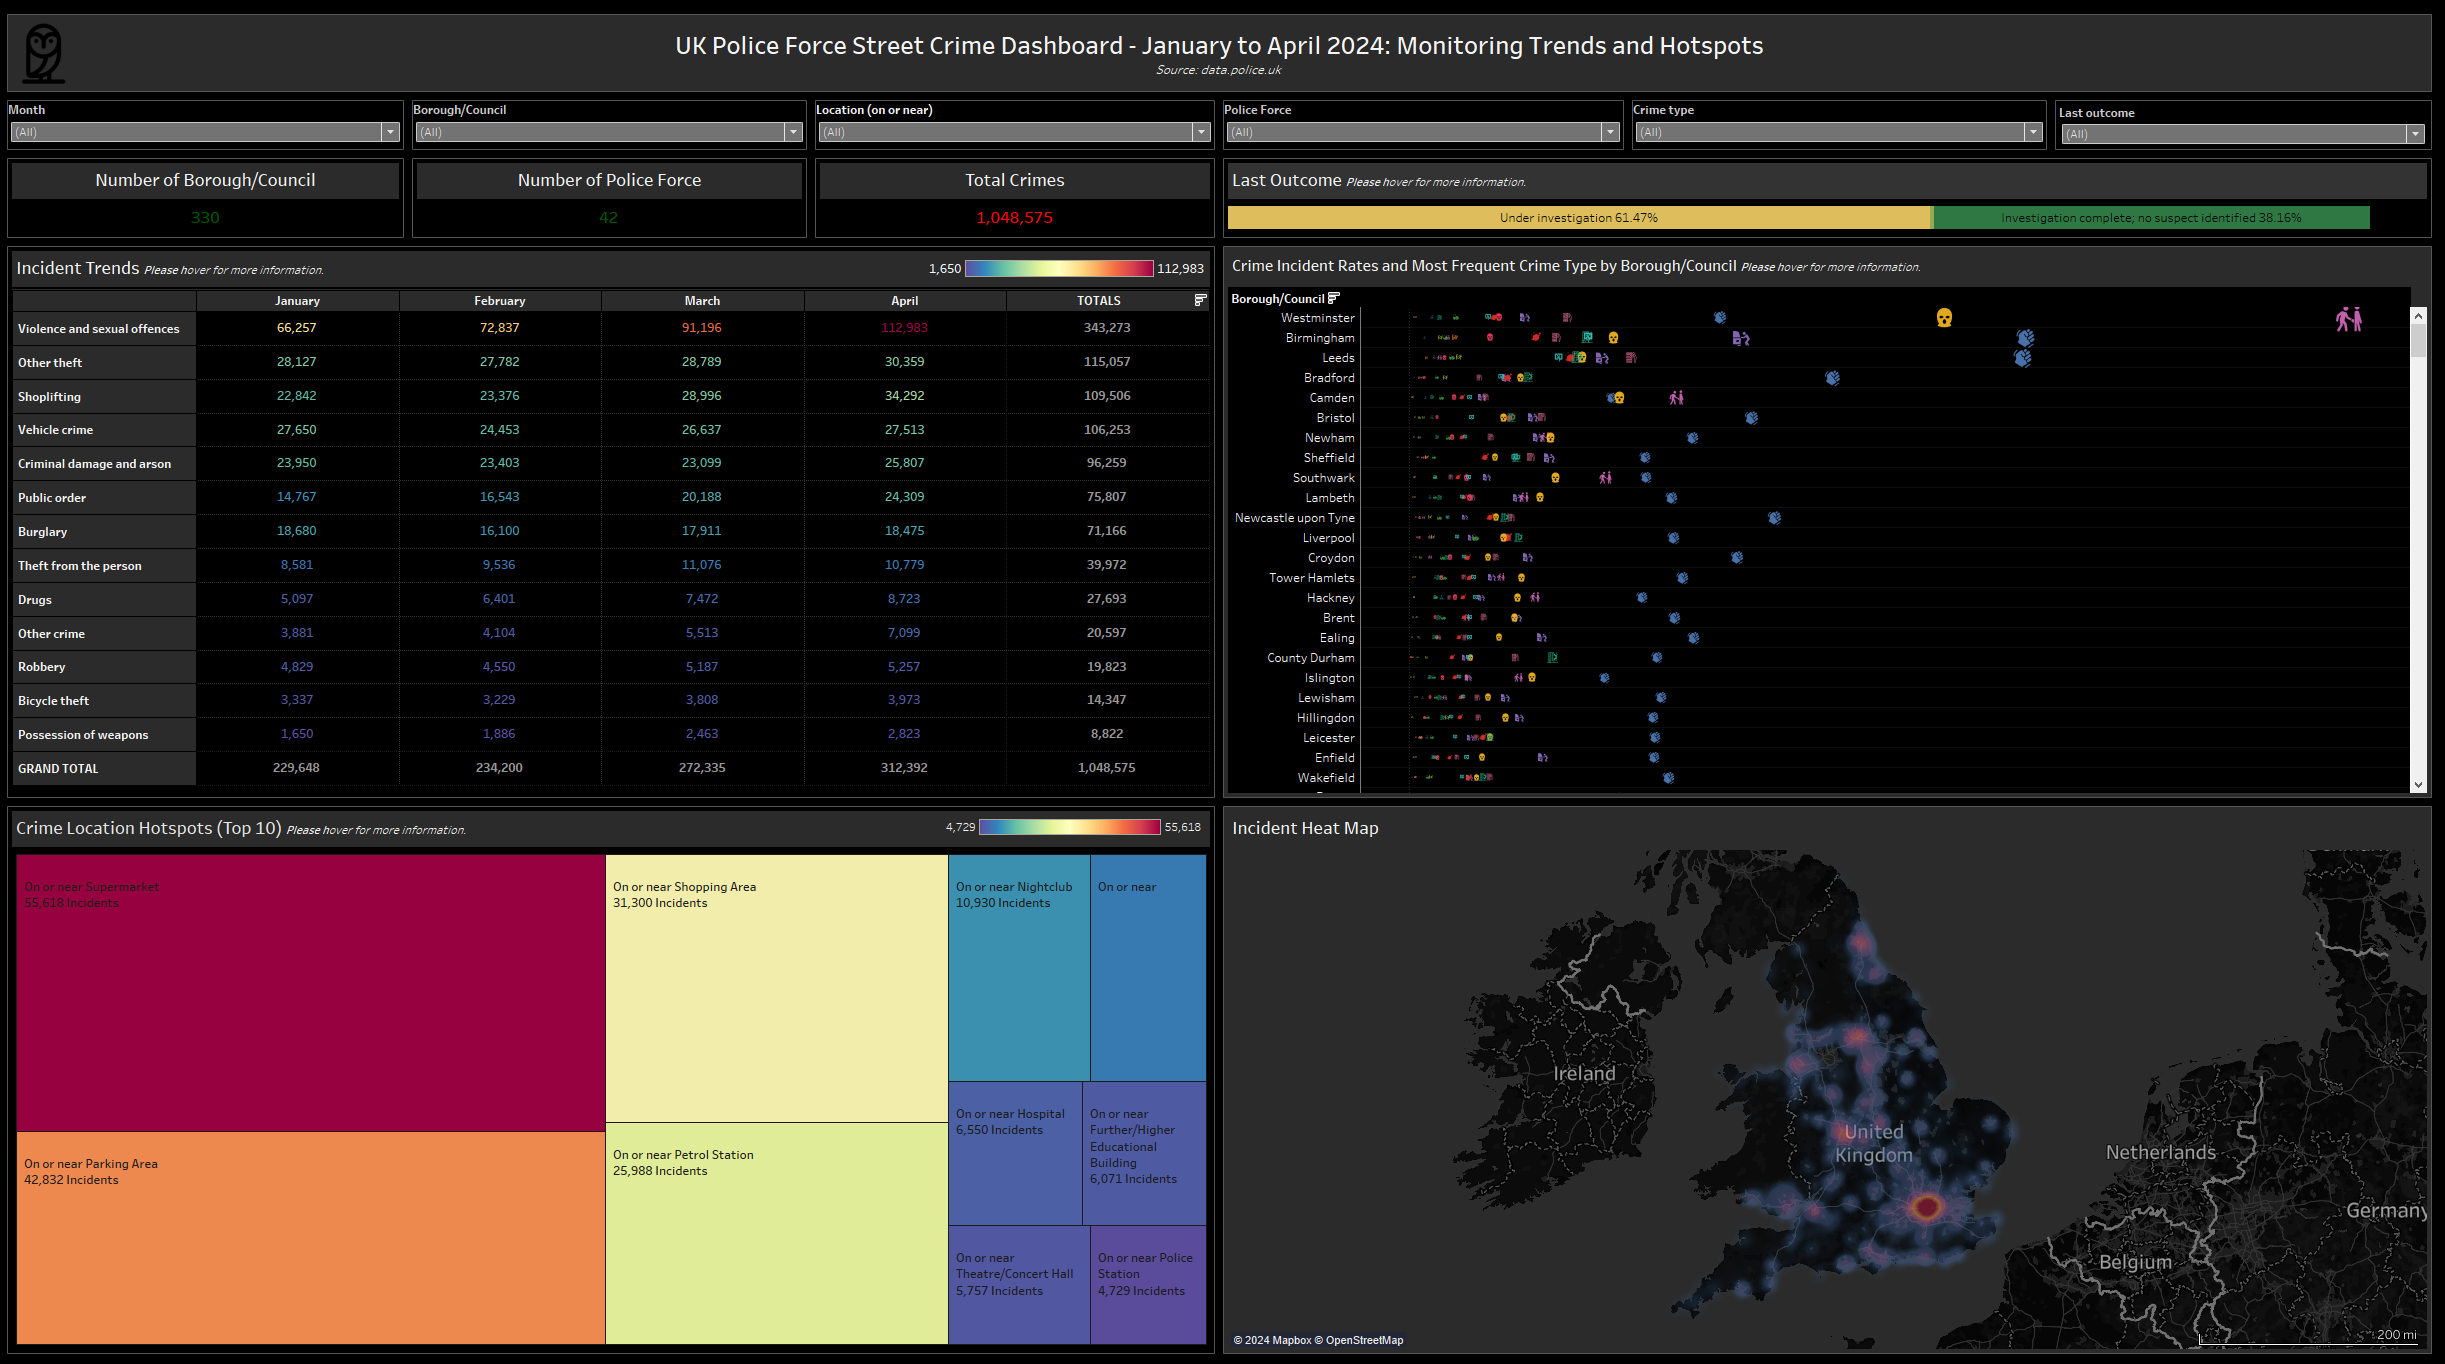
Scope
Purpose and Objectives
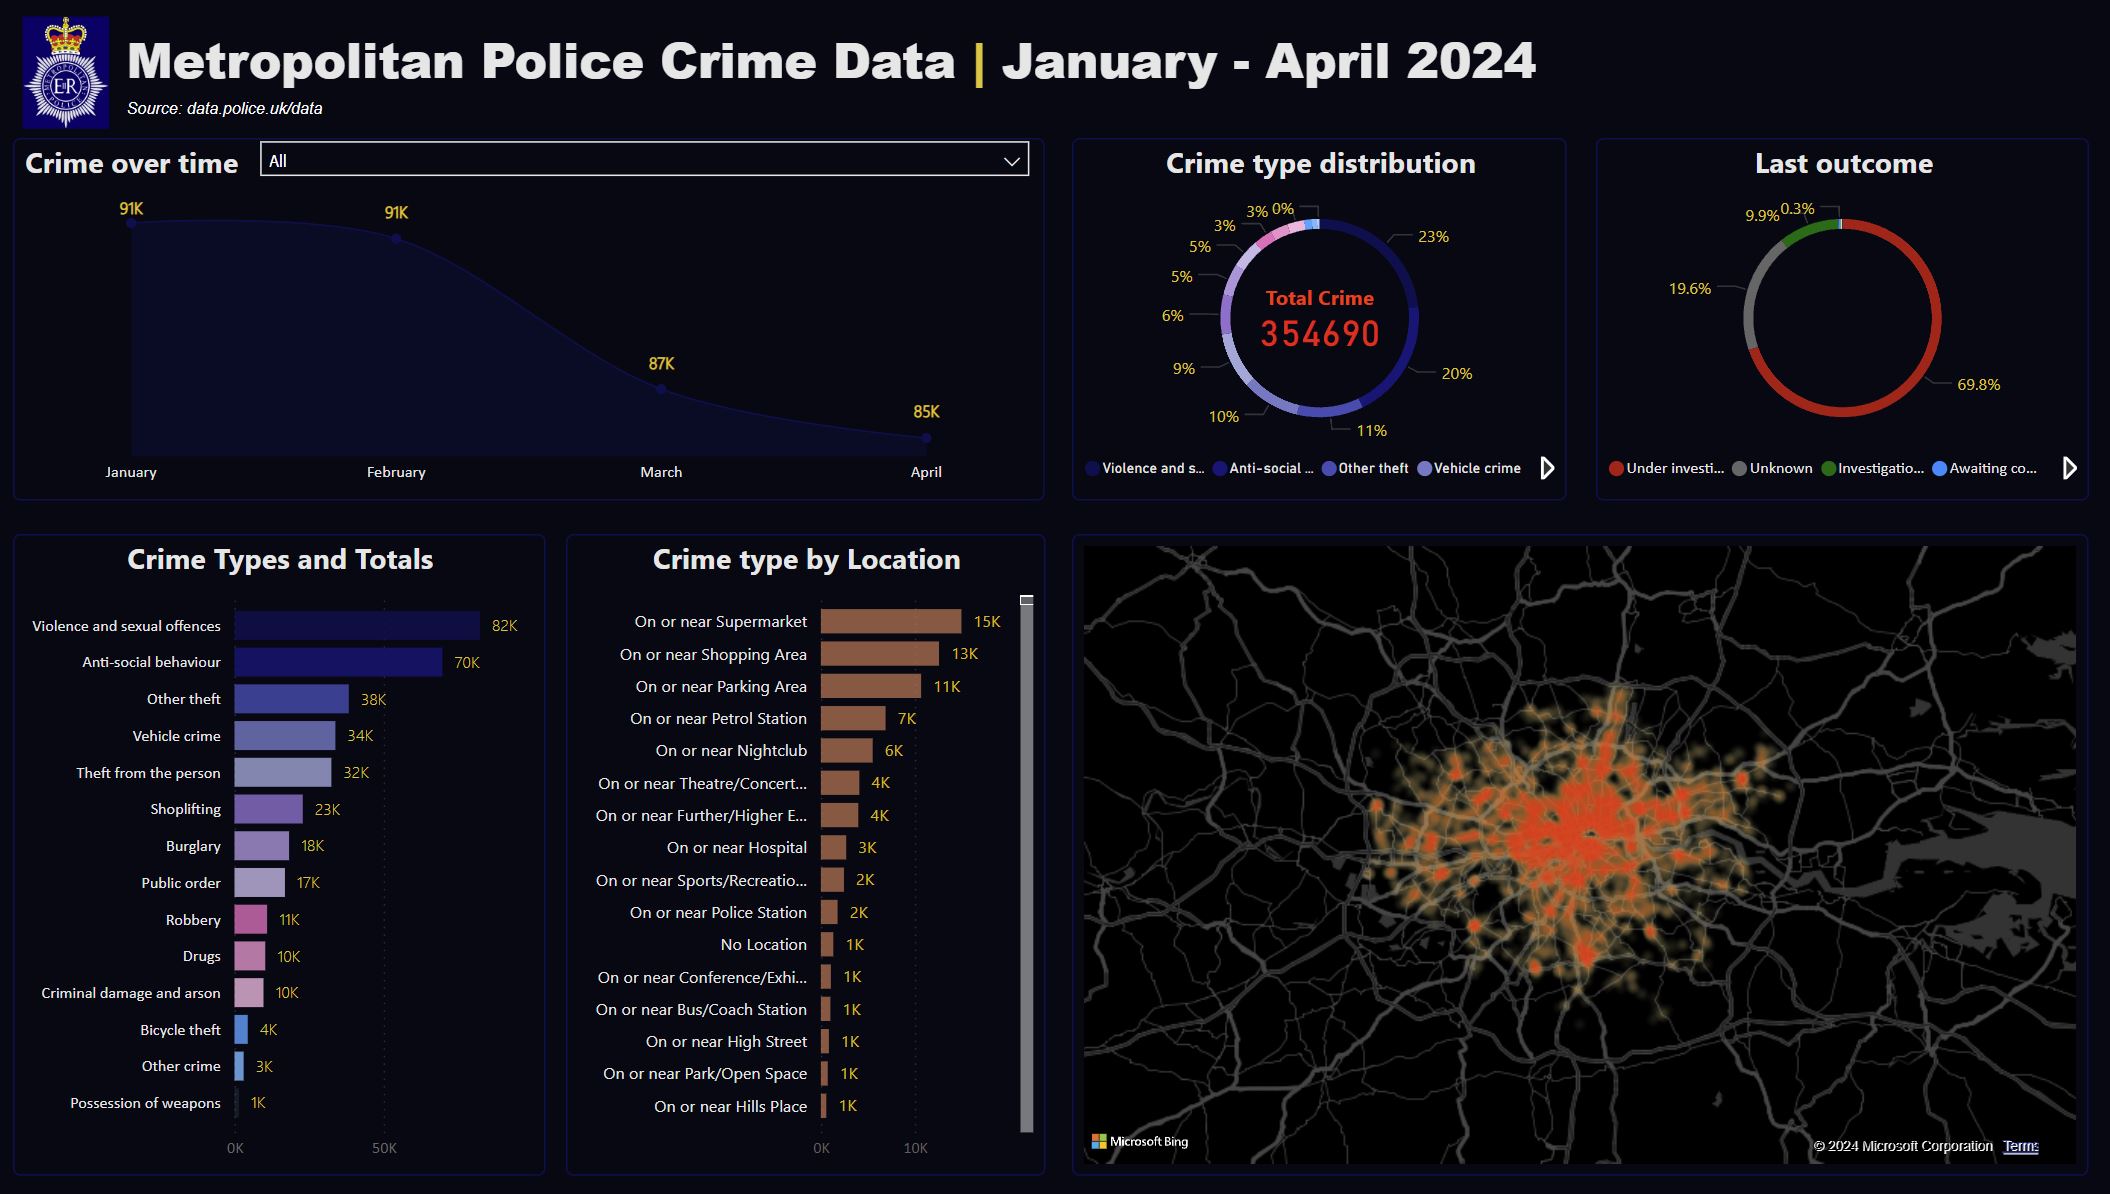
Monitoring trends and identifying hotspots in street crime in the UK
Questions it should answer: What are the trends in street crime over the specified period? Where are the hotspots of street crime located?
Decisions it should inform: Deployment of police resources, adjustment of crime prevention strategies, and allocation of investigative efforts.
Tools Used for this Project
Tableau, Excel, Power BI, and Python
Power BI - UK Street Crimes | KPI Cards | January - May 2024
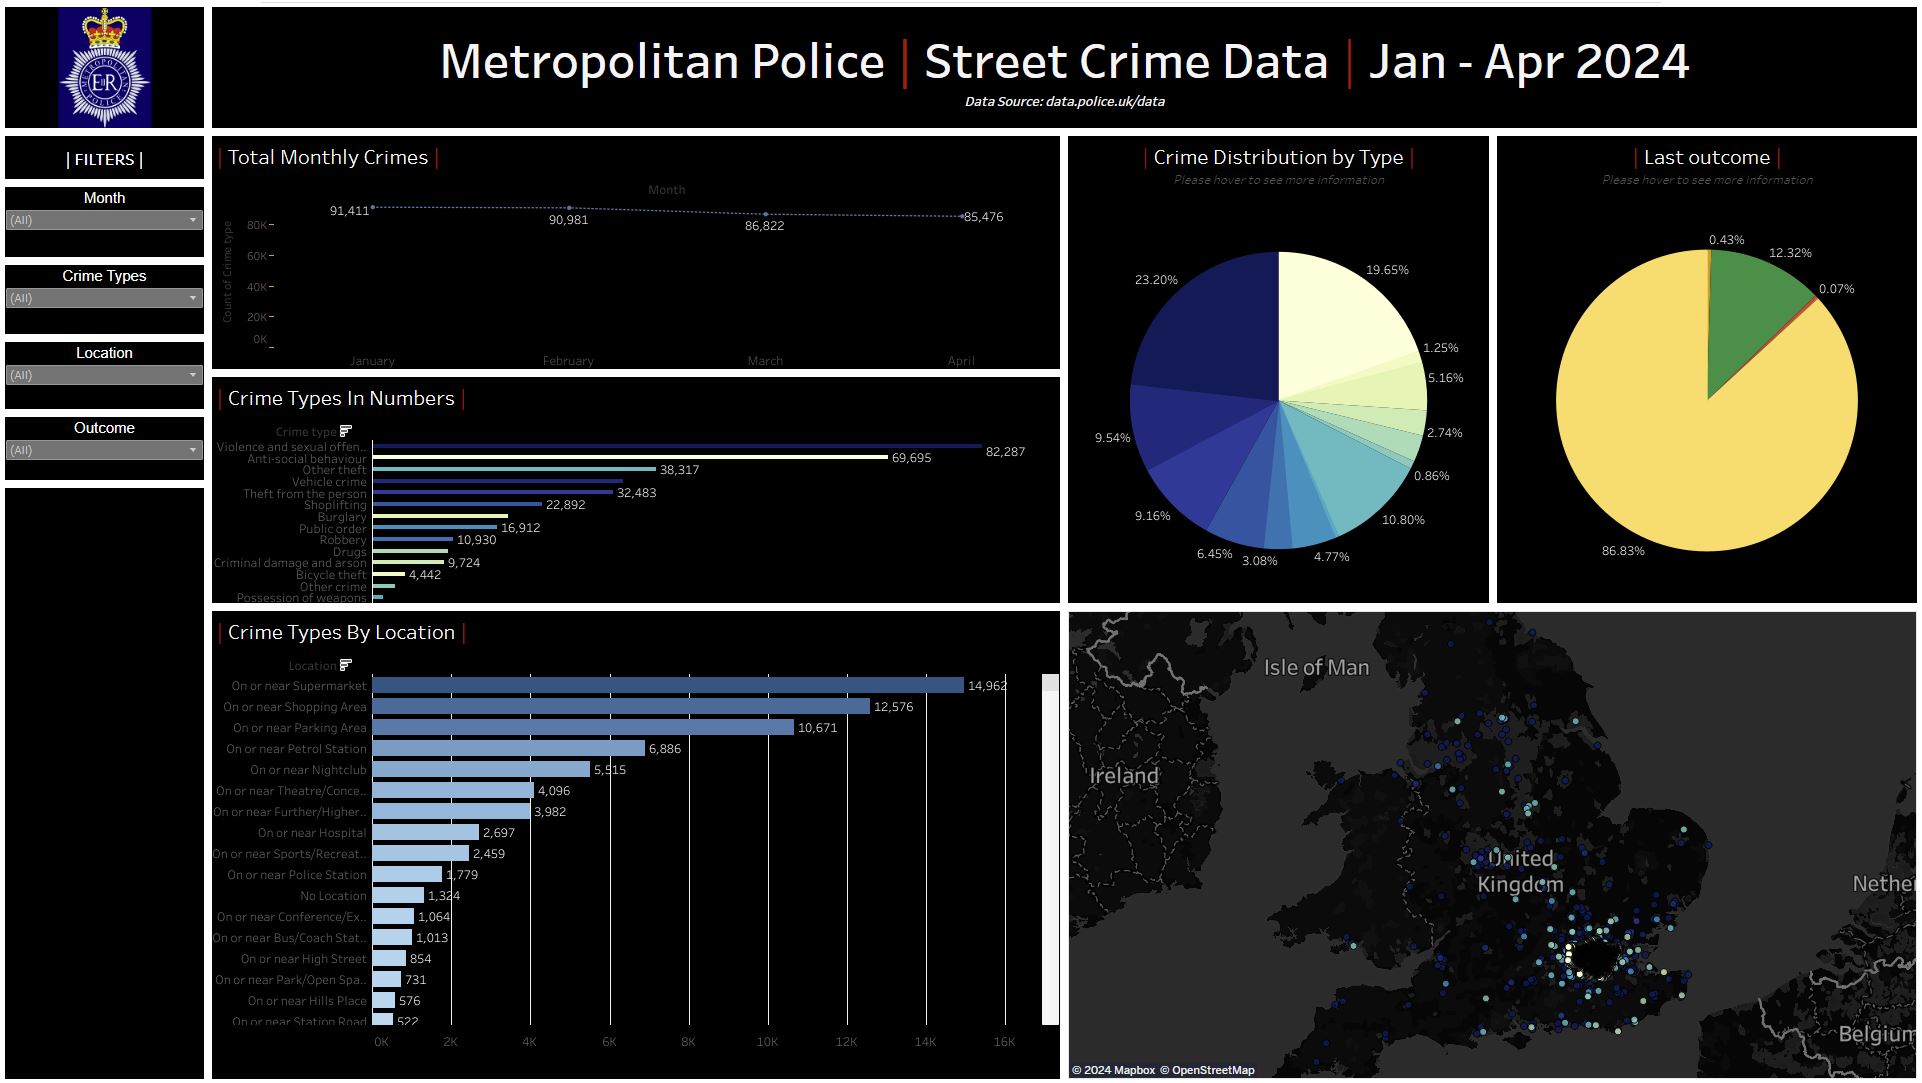
Tableau - Metropolitan Police | Street Crime Data | January - April 2024
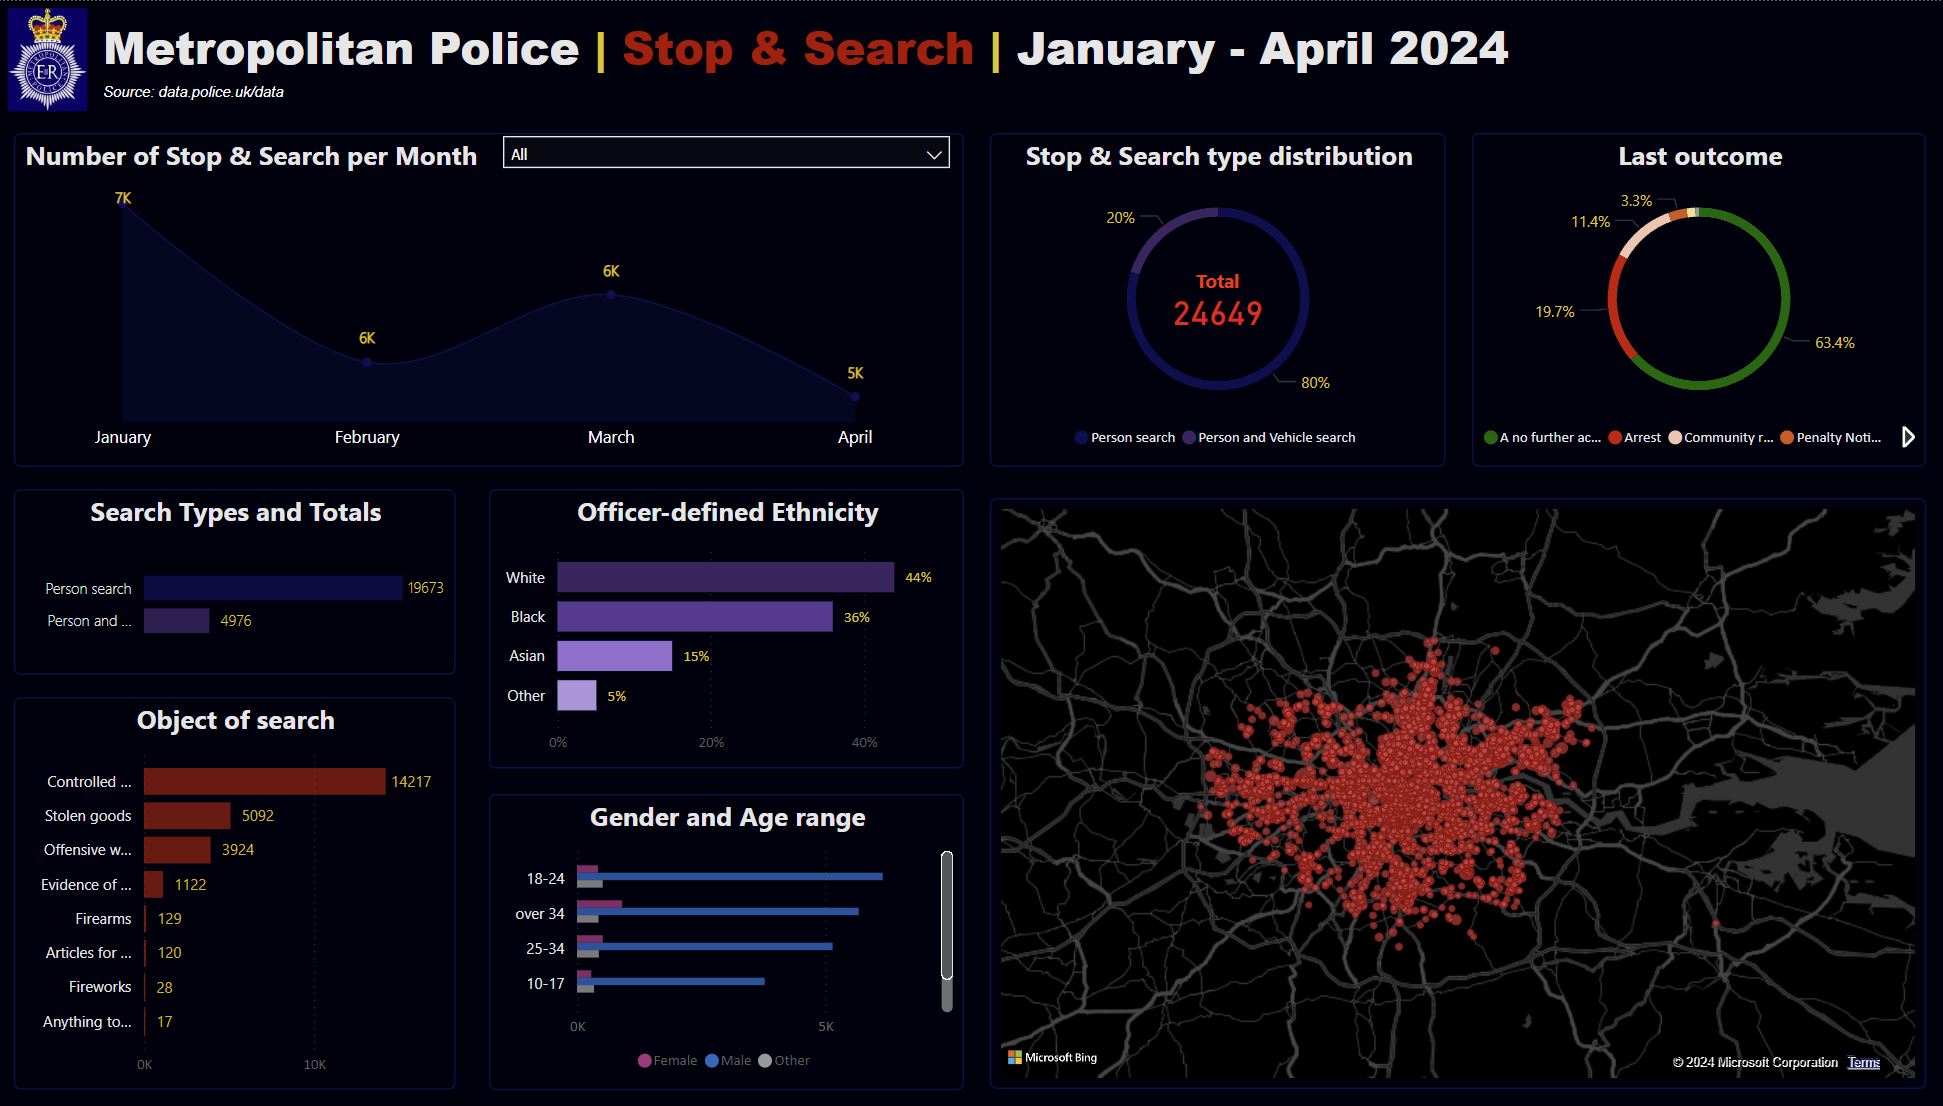
Power BI - Metropolitan Police | Stop & Search | January - April 2024
Power BI - Metropolitan Police | Street Crime | January - April 2024
Just IT Assignments
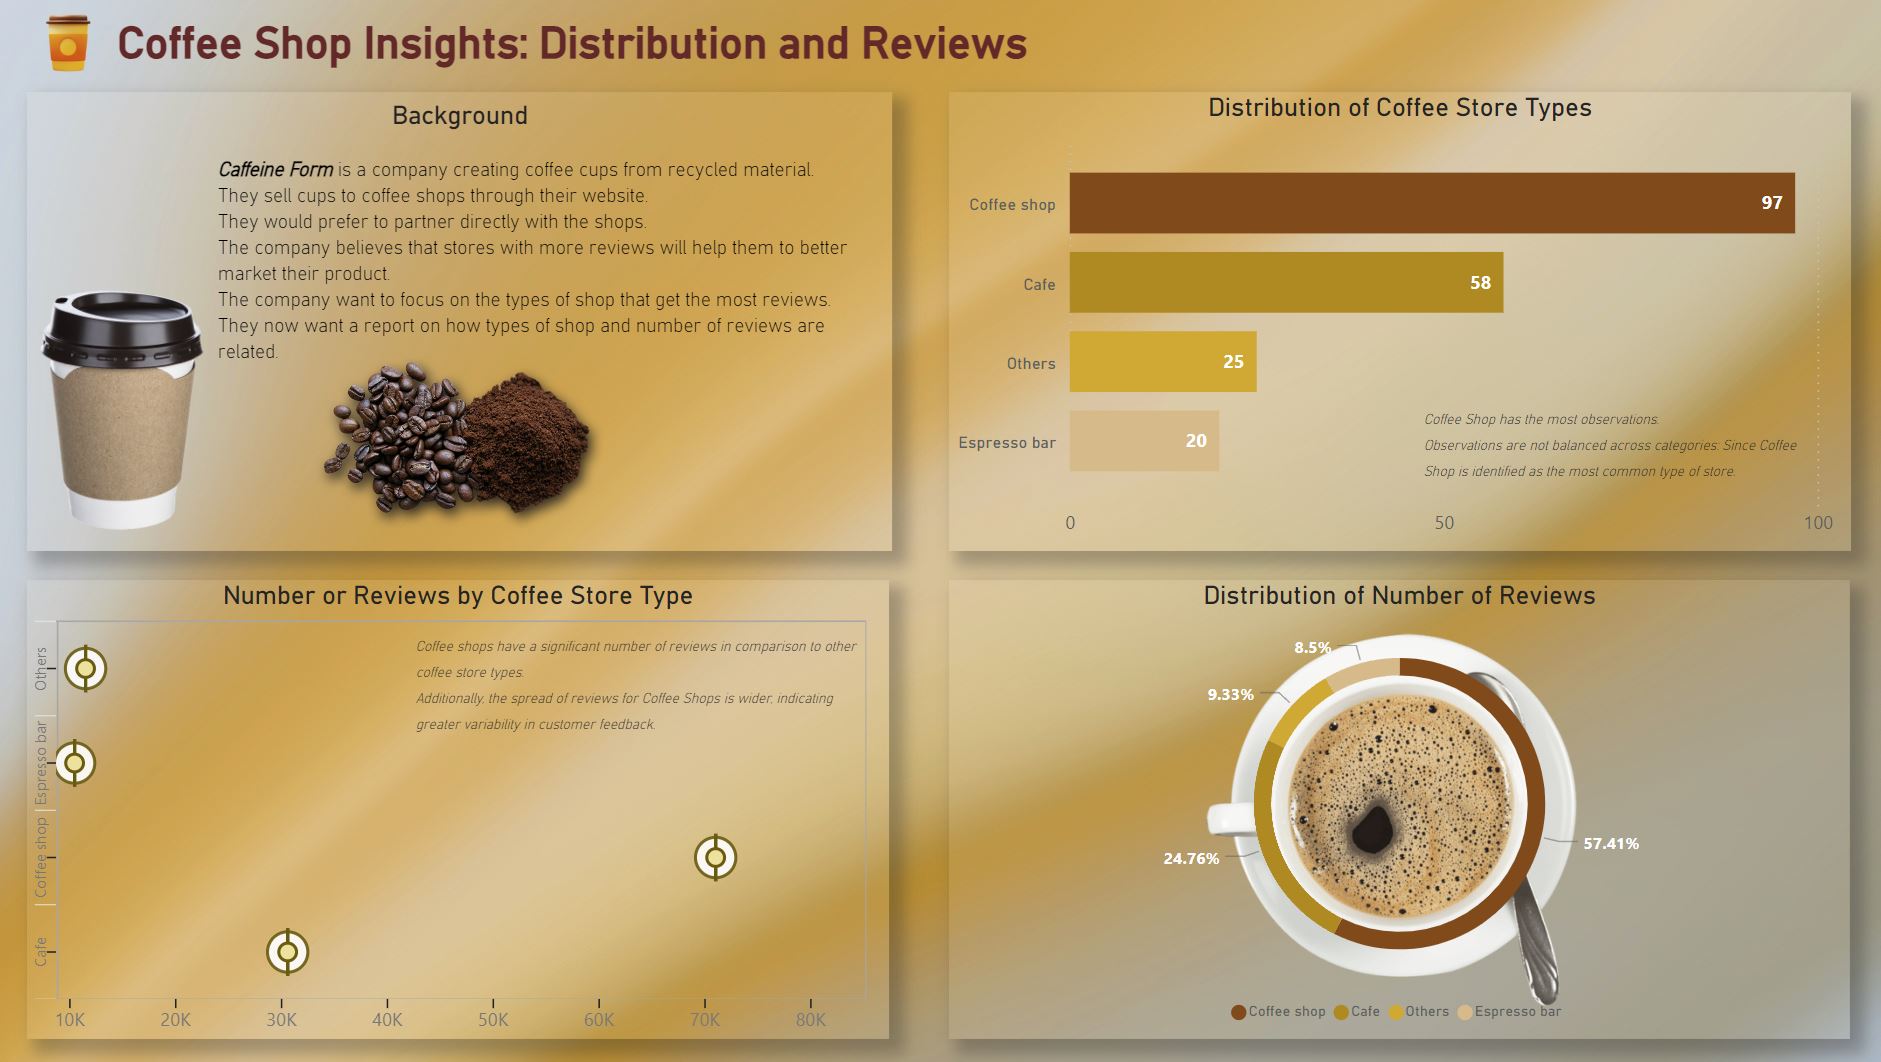
Power BI - Practical Task - Caffeine Form
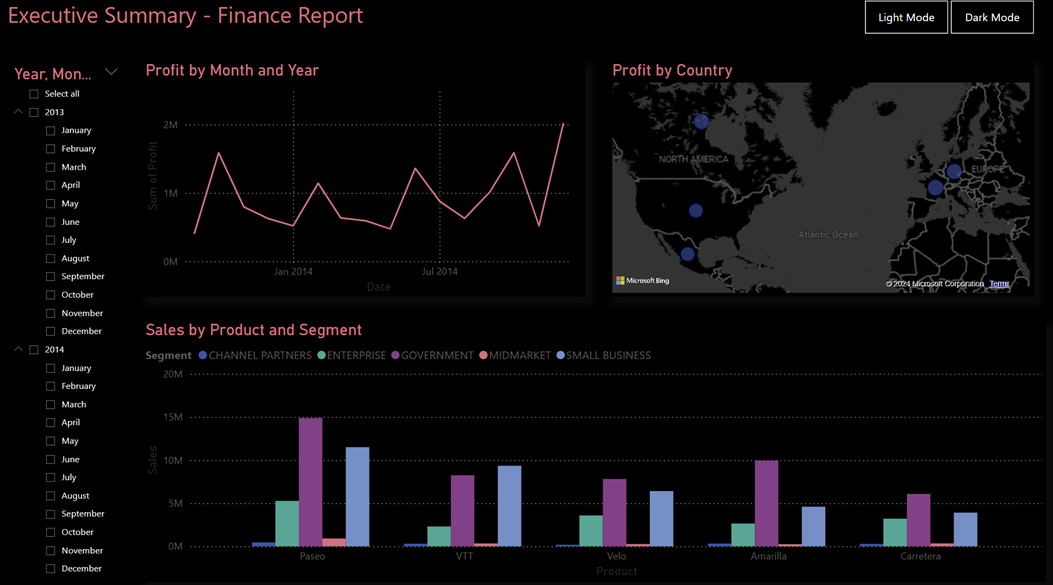
Power BI - Executive Summary Dashboard (Dark)
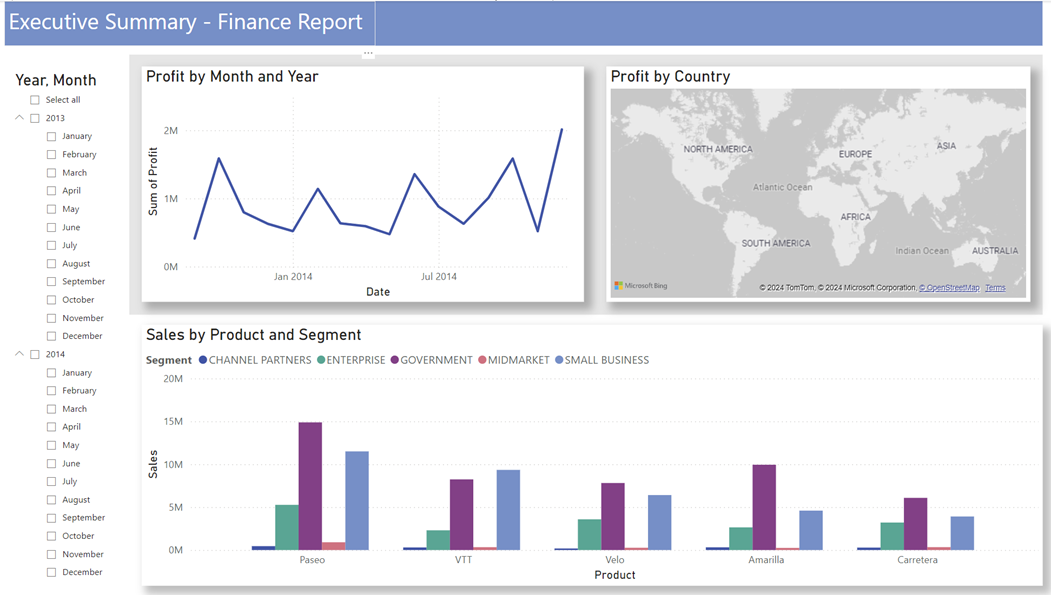
Power BI - Executive Summary Dashboard (Light)
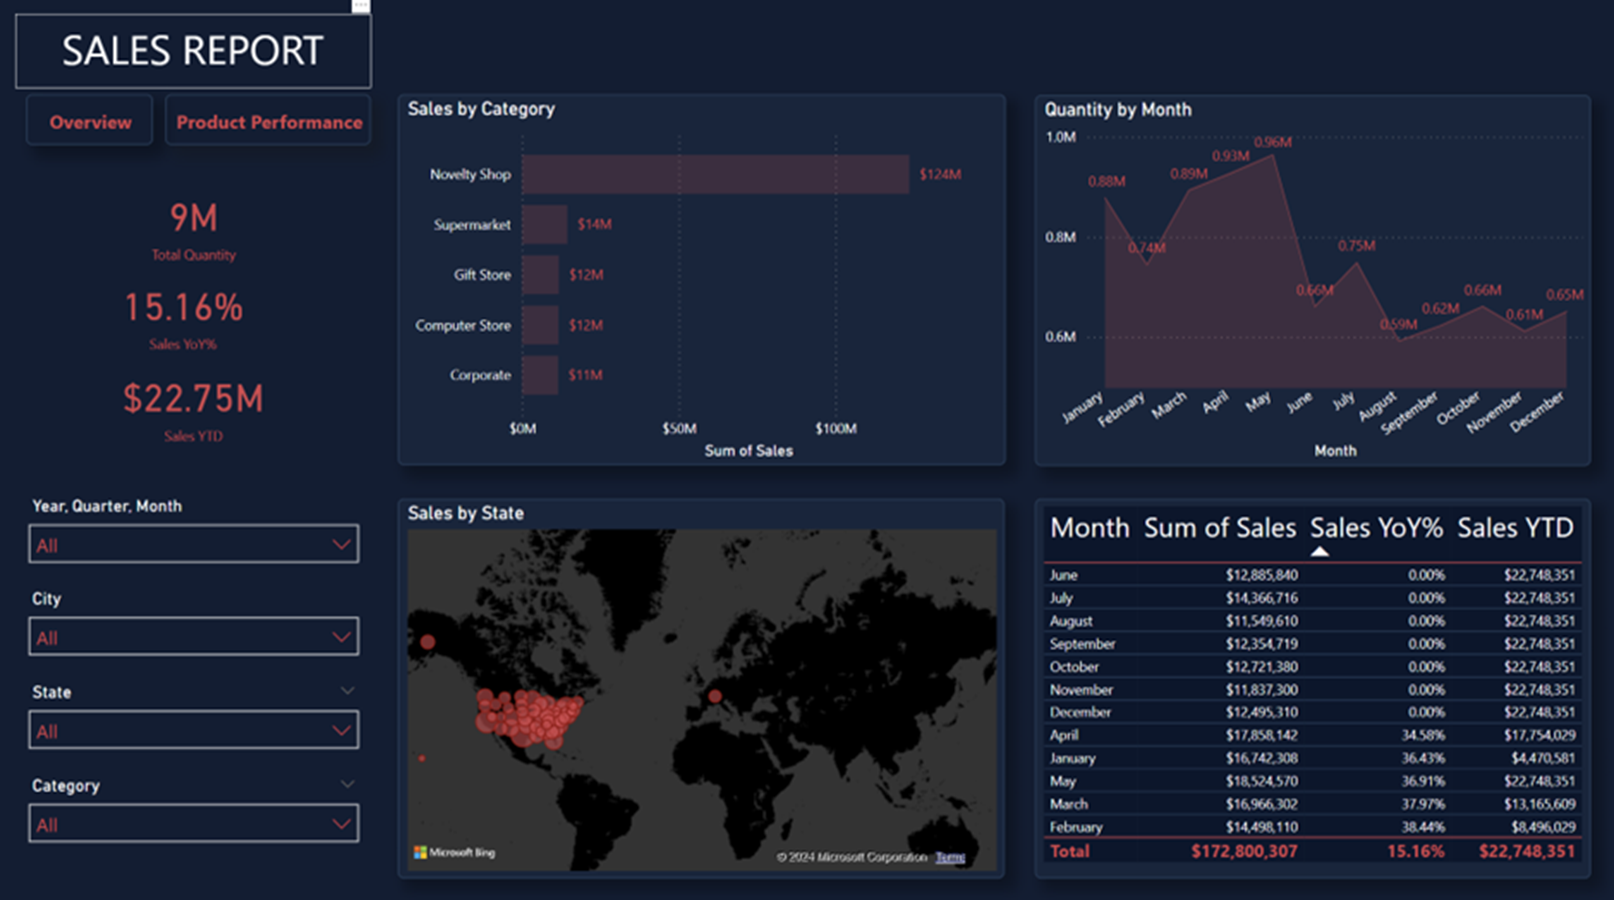
Power BI - Sales Report Dashboard
Power BI - Dashboard Exercise
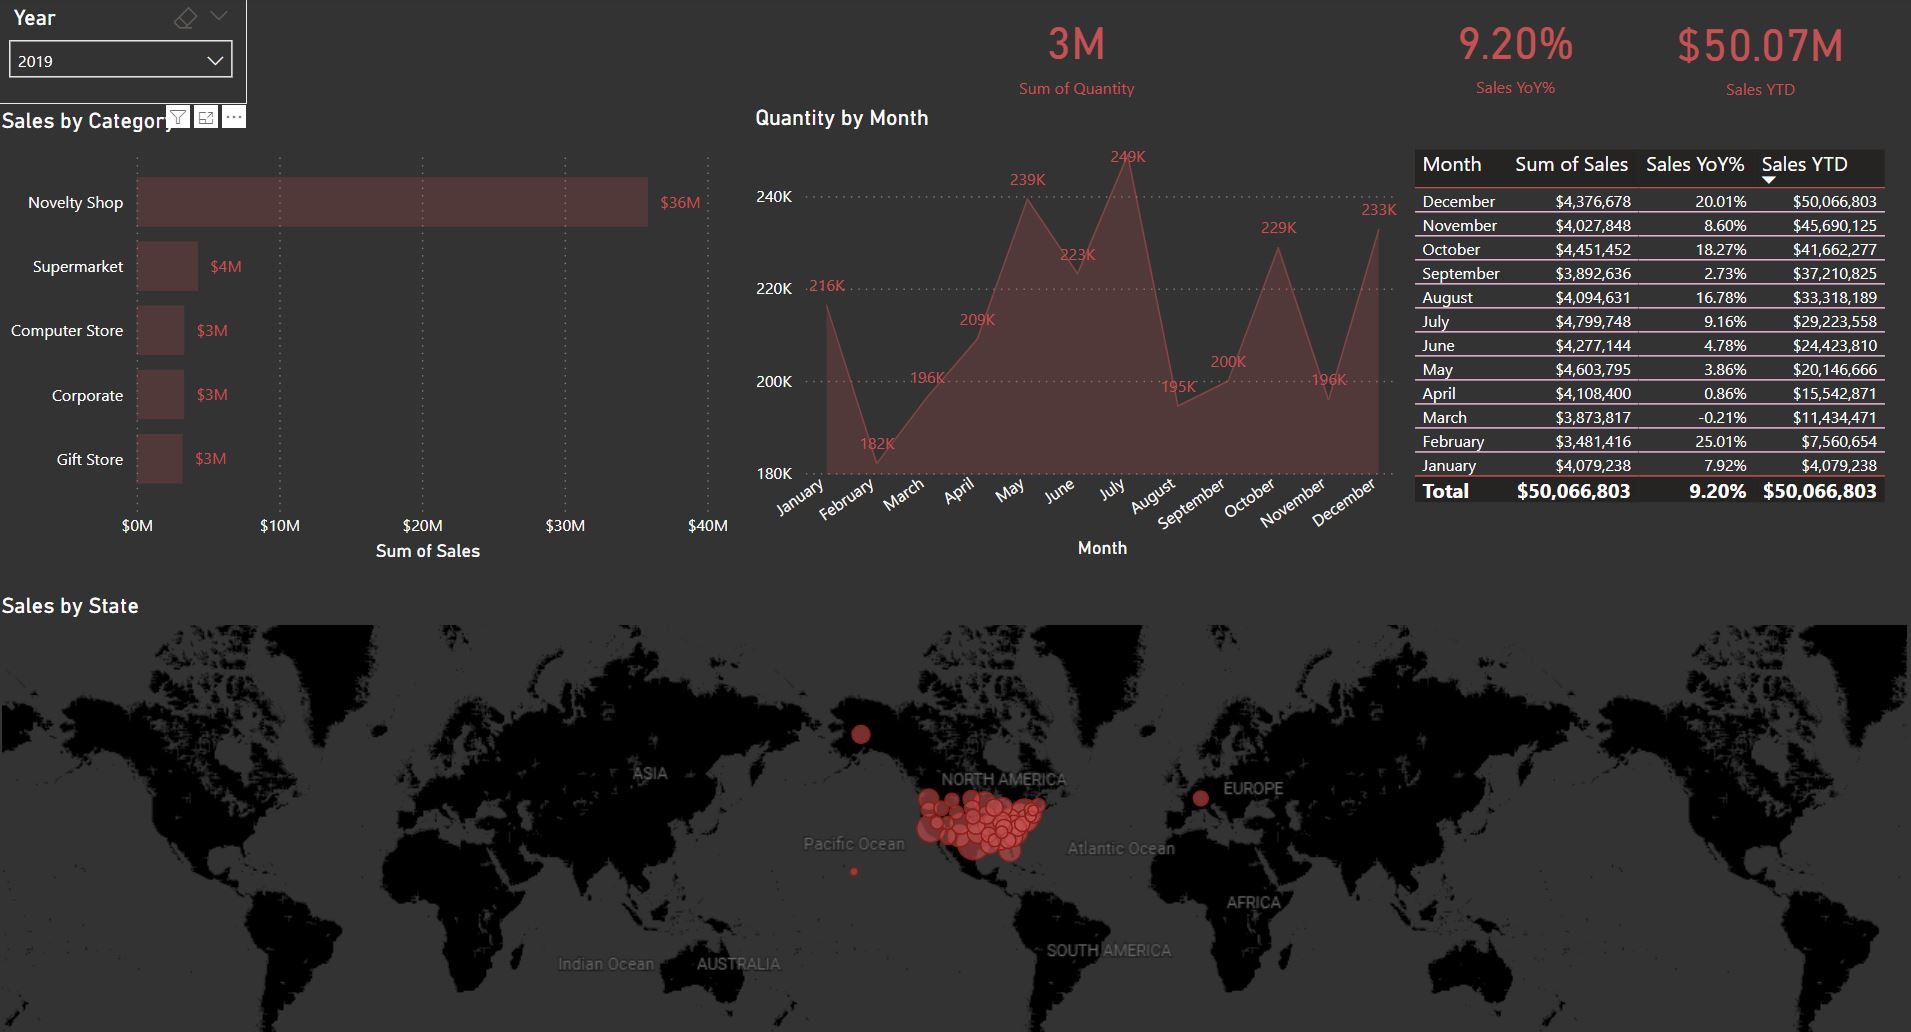
Tableau - The Wealth of Nations
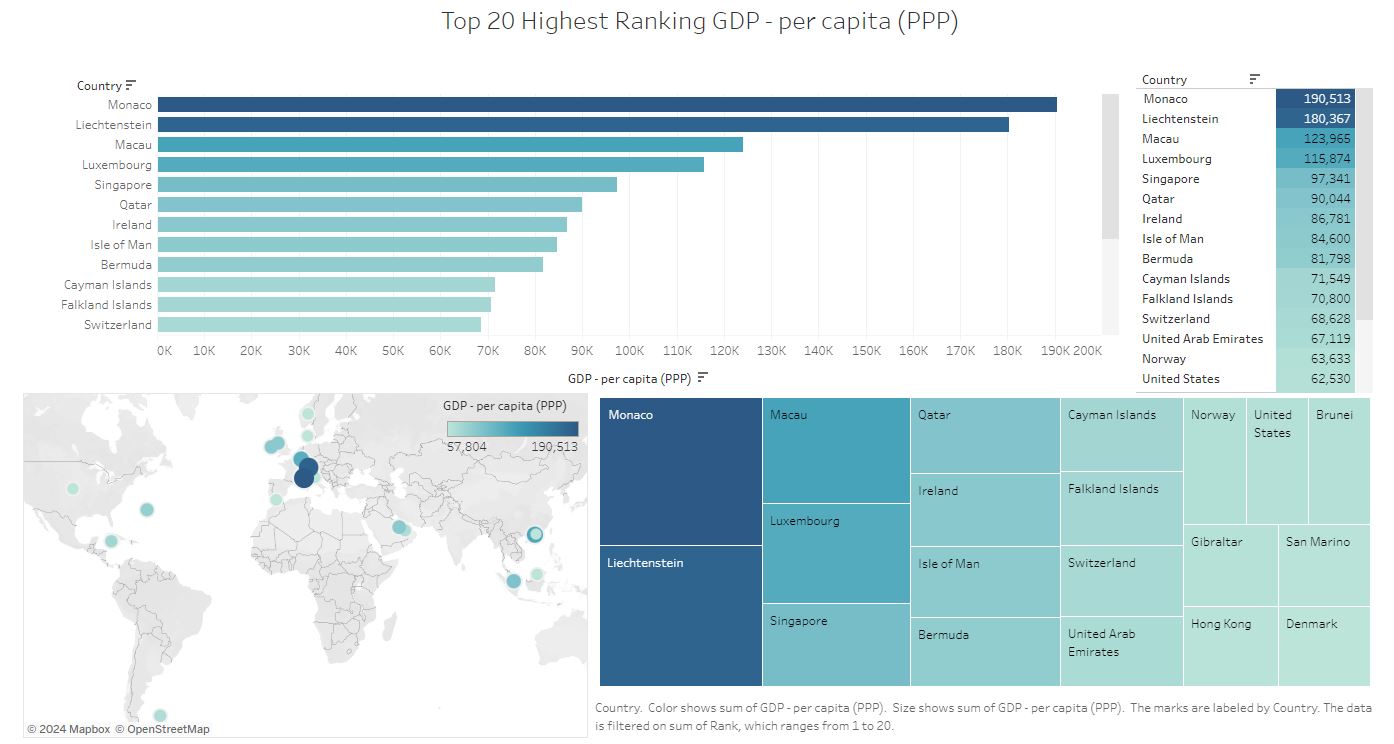
Tableau - Changes in the British Industry
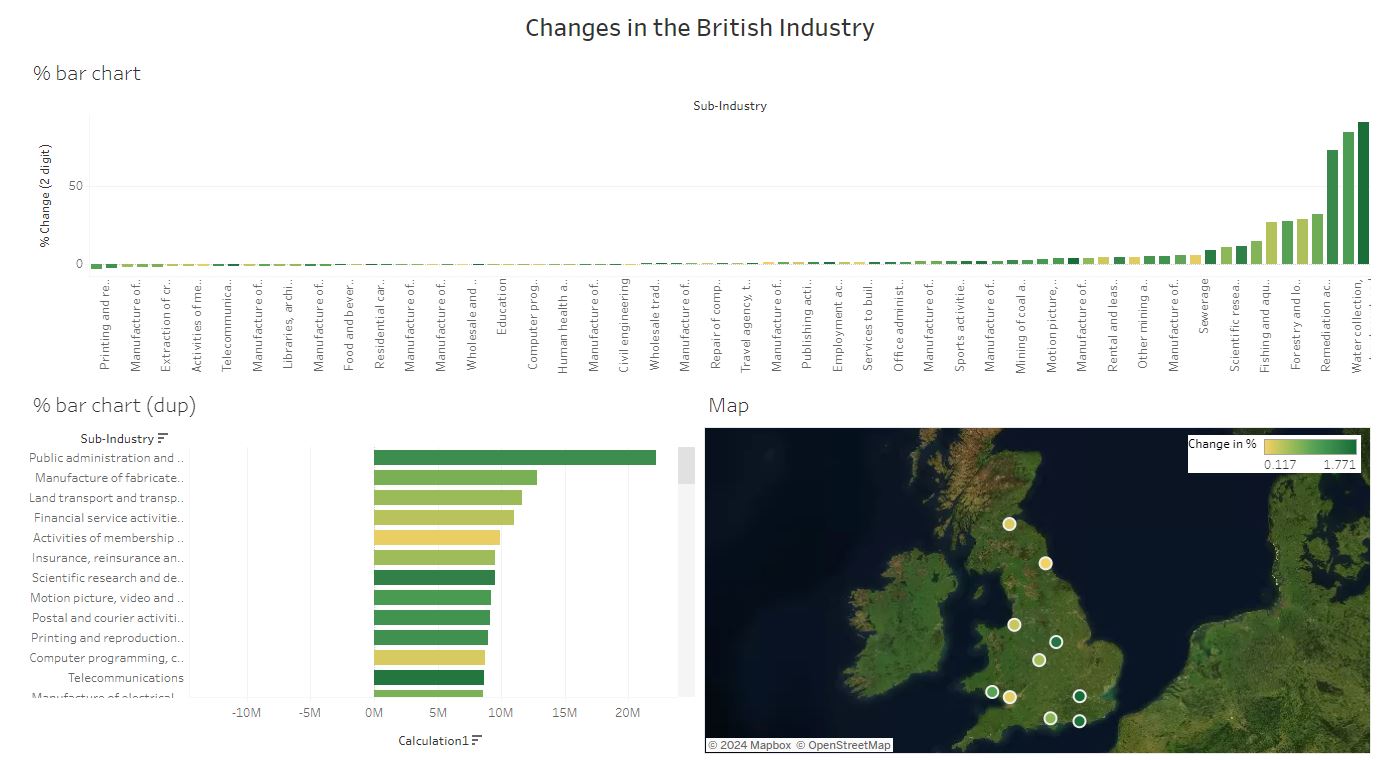
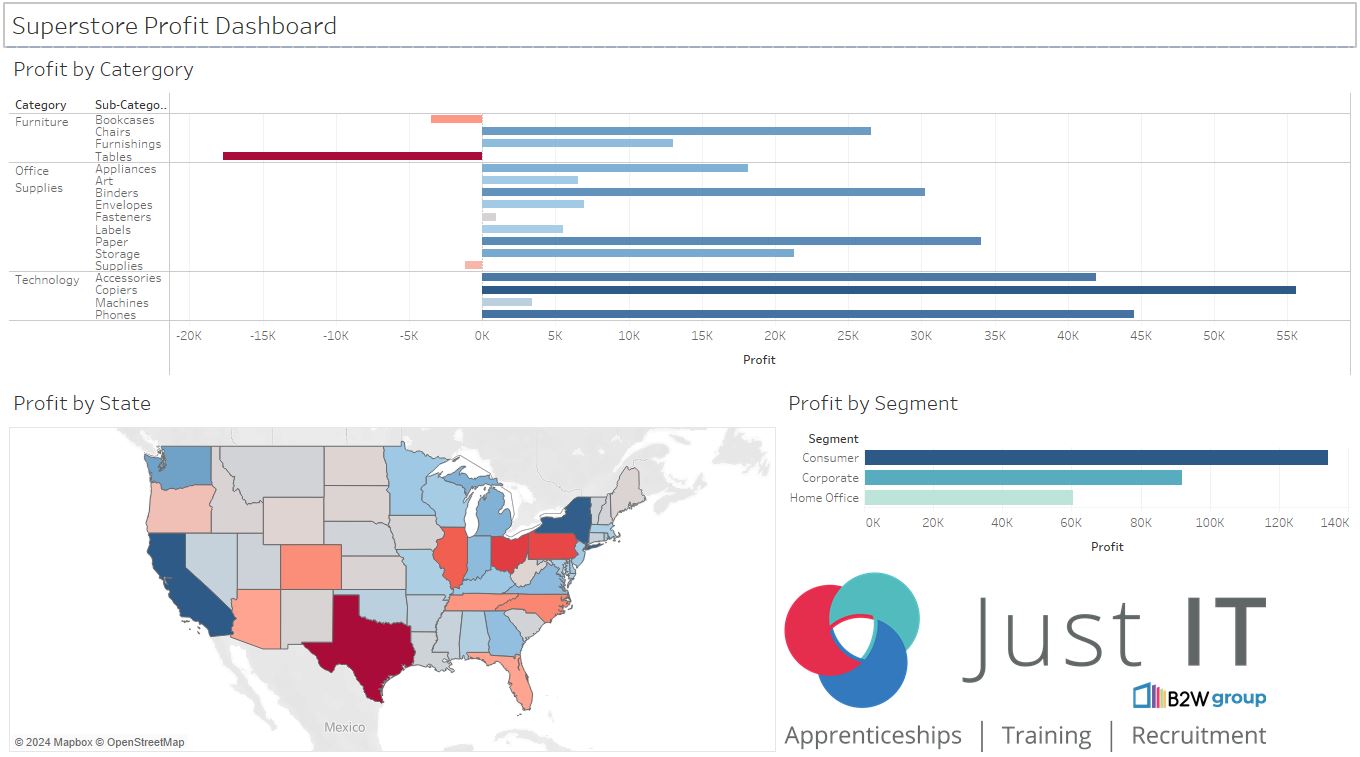
Tableau - Superstore Profit Dashboard
Tableau
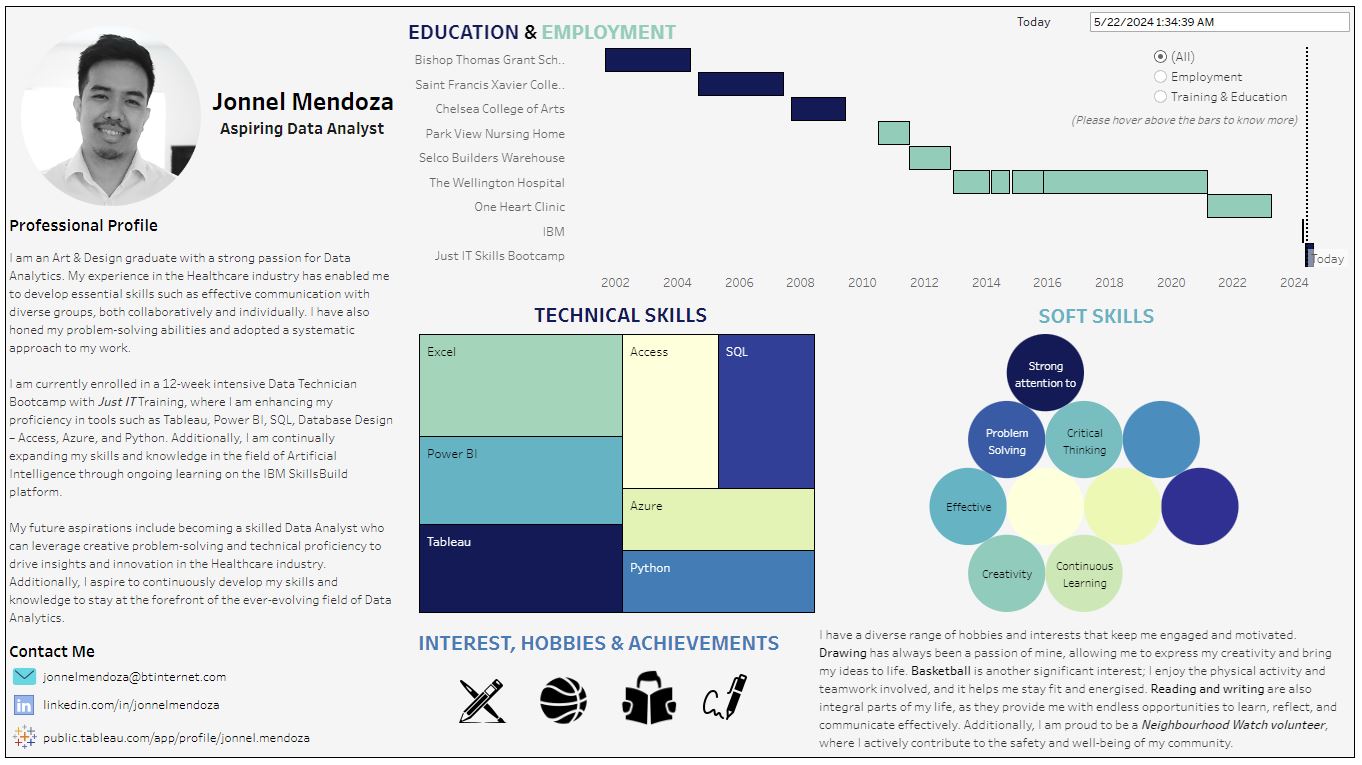
Tableau - Report Turnaround Times - Imaging Department (finding breach)
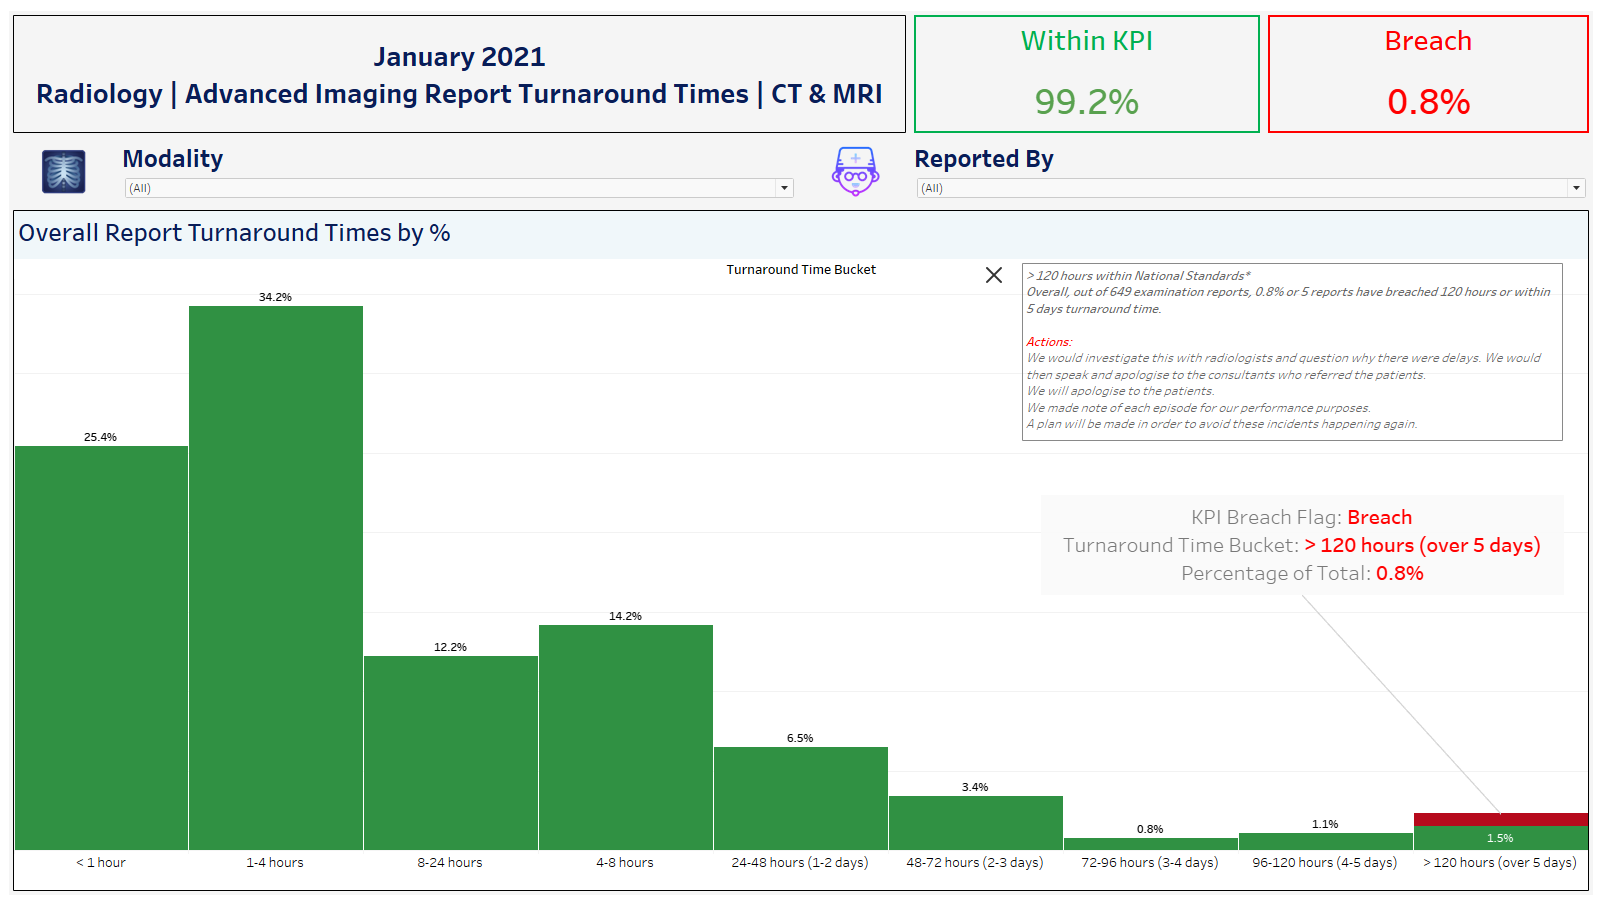
Tableau - Patient Satisfaction Survey Results - Imaging Department
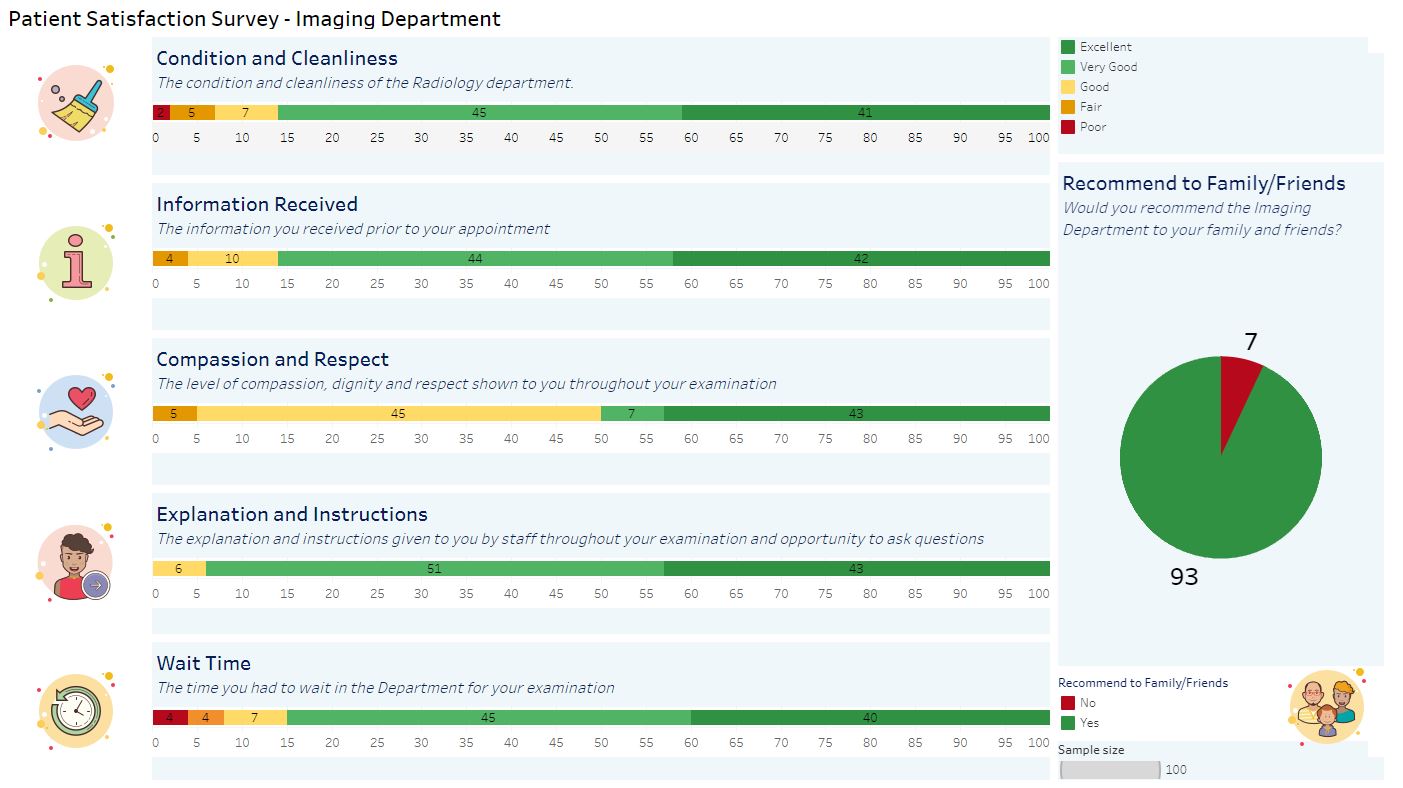
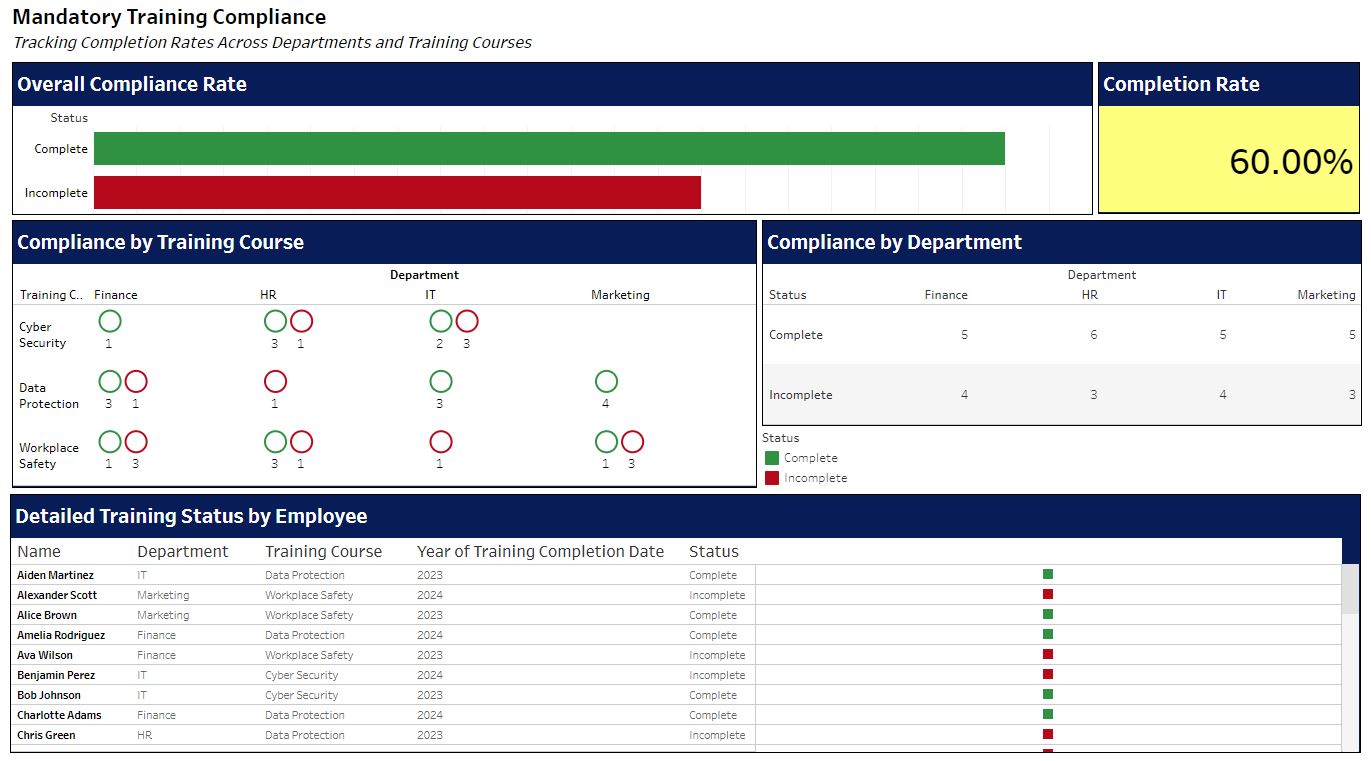
Tableau - Mandatory Training Compliance Dashboard
See my GitHub Repository
Page template forked from evanca